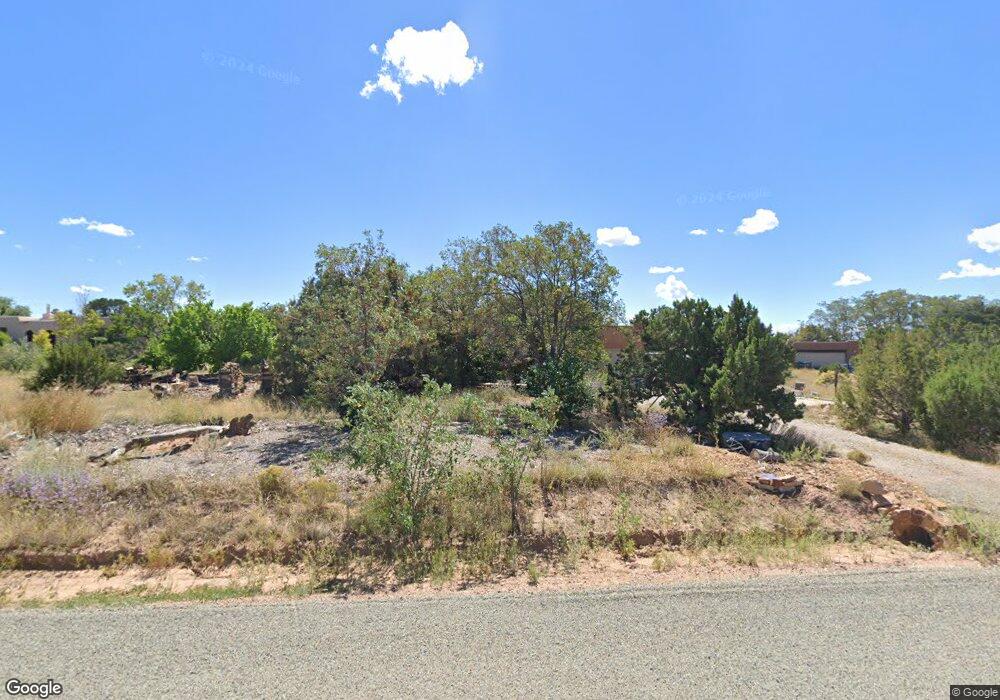
95 Moya Rd Santa Fe, NM 87508
Eldorado at Santa Fe NeighborhoodEstimated Value: $548,000 - $624,252
3
Beds
2
Baths
1,600
Sq Ft
$374/Sq Ft
Est. Value
About This Home
This home is located at 95 Moya Rd, Santa Fe, NM 87508 and is currently estimated at $598,063, approximately $373 per square foot. 95 Moya Rd is a home located in Santa Fe County with nearby schools including El Dorado Community School and Santa Fe High School.
Ownership History
Date
Name
Owned For
Owner Type
Purchase Details
Closed on
May 17, 2010
Sold by
Pierce Steven T and Pierce Betsy C
Bought by
Condon Rita and Condon Brooks
Current Estimated Value
Home Financials for this Owner
Home Financials are based on the most recent Mortgage that was taken out on this home.
Original Mortgage
$194,000
Outstanding Balance
$129,603
Interest Rate
5.14%
Mortgage Type
New Conventional
Estimated Equity
$468,460
Create a Home Valuation Report for This Property
The Home Valuation Report is an in-depth analysis detailing your home's value as well as a comparison with similar homes in the area
Home Values in the Area
Average Home Value in this Area
Purchase History
| Date | Buyer | Sale Price | Title Company |
|---|---|---|---|
| Condon Rita | -- | St&E |
Source: Public Records
Mortgage History
| Date | Status | Borrower | Loan Amount |
|---|---|---|---|
| Open | Condon Rita | $194,000 |
Source: Public Records
Tax History Compared to Growth
Tax History
| Year | Tax Paid | Tax Assessment Tax Assessment Total Assessment is a certain percentage of the fair market value that is determined by local assessors to be the total taxable value of land and additions on the property. | Land | Improvement |
|---|---|---|---|---|
| 2025 | $1,947 | $263,555 | $70,250 | $193,305 |
| 2024 | $2,053 | $255,879 | $68,204 | $187,675 |
| 2023 | $2,052 | $248,427 | $66,218 | $182,209 |
| 2022 | $1,931 | $241,192 | $64,290 | $176,902 |
| 2021 | $1,904 | $78,056 | $20,805 | $57,251 |
| 2020 | $1,867 | $75,783 | $20,199 | $55,584 |
| 2019 | $1,823 | $73,576 | $20,199 | $53,377 |
| 2018 | $1,780 | $71,433 | $20,199 | $51,234 |
| 2017 | $1,729 | $69,353 | $20,199 | $49,154 |
| 2016 | $1,619 | $67,333 | $20,993 | $46,340 |
| 2015 | $1,595 | $65,372 | $20,382 | $44,990 |
| 2014 | $1,446 | $63,405 | $16,319 | $47,086 |
Source: Public Records
Map
Nearby Homes