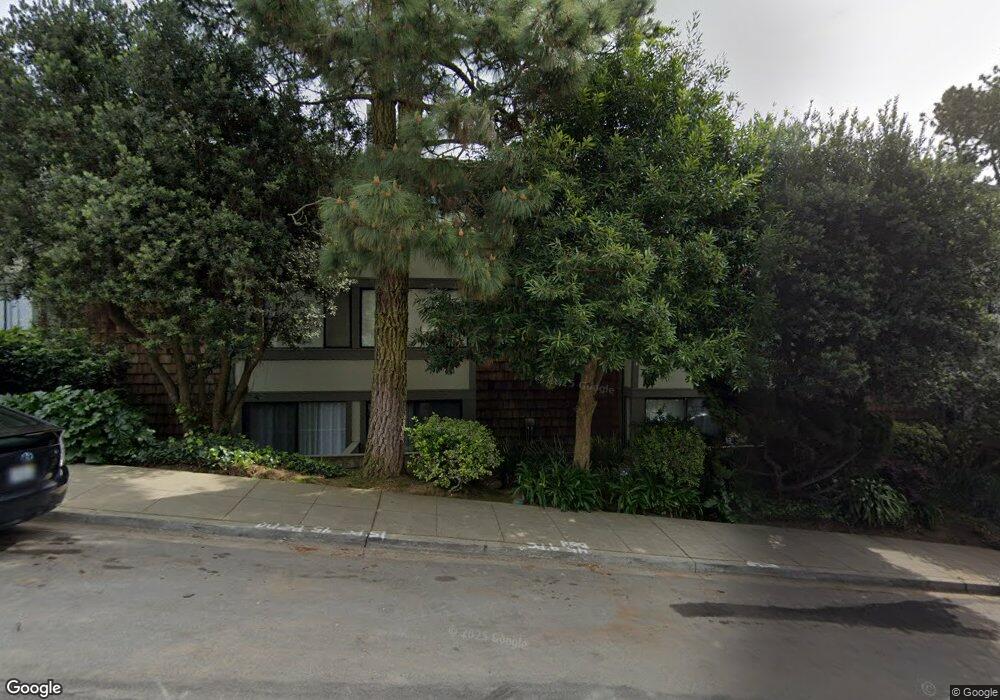
95 Ora Way Unit F304 San Francisco, CA 94131
Diamond Heights NeighborhoodEstimated Value: $416,000 - $653,000
2
Beds
1
Bath
890
Sq Ft
$625/Sq Ft
Est. Value
About This Home
This home is located at 95 Ora Way Unit F304, San Francisco, CA 94131 and is currently estimated at $556,296, approximately $625 per square foot. 95 Ora Way Unit F304 is a home located in San Francisco County with nearby schools including Miraloma Elementary School, Denman (James) Middle School, and St John Catholic School.
Ownership History
Date
Name
Owned For
Owner Type
Purchase Details
Closed on
Jun 28, 2002
Sold by
Bremner Todd
Bought by
Fraunfelder Gregory J
Current Estimated Value
Home Financials for this Owner
Home Financials are based on the most recent Mortgage that was taken out on this home.
Original Mortgage
$135,000
Outstanding Balance
$57,513
Interest Rate
6.78%
Mortgage Type
Purchase Money Mortgage
Estimated Equity
$498,783
Purchase Details
Closed on
Sep 10, 1998
Sold by
Leftkowitz Arna
Bought by
Bremmer Todd
Home Financials for this Owner
Home Financials are based on the most recent Mortgage that was taken out on this home.
Original Mortgage
$157,450
Interest Rate
6.92%
Mortgage Type
Purchase Money Mortgage
Purchase Details
Closed on
Oct 14, 1996
Sold by
Mathes Robert A
Bought by
Lefkowitz Arna
Home Financials for this Owner
Home Financials are based on the most recent Mortgage that was taken out on this home.
Original Mortgage
$110,500
Interest Rate
8.3%
Mortgage Type
Purchase Money Mortgage
Create a Home Valuation Report for This Property
The Home Valuation Report is an in-depth analysis detailing your home's value as well as a comparison with similar homes in the area
Home Values in the Area
Average Home Value in this Area
Purchase History
| Date | Buyer | Sale Price | Title Company |
|---|---|---|---|
| Fraunfelder Gregory J | $232,500 | Fidelity National Title Co | |
| Bremmer Todd | $185,500 | Fidelity National Title Co | |
| Lefkowitz Arna | $160,500 | Fidelity National Title Co |
Source: Public Records
Mortgage History
| Date | Status | Borrower | Loan Amount |
|---|---|---|---|
| Open | Fraunfelder Gregory J | $135,000 | |
| Previous Owner | Bremmer Todd | $157,450 | |
| Previous Owner | Lefkowitz Arna | $110,500 | |
| Closed | Fraunfelder Gregory J | $69,750 |
Source: Public Records
Tax History Compared to Growth
Tax History
| Year | Tax Paid | Tax Assessment Tax Assessment Total Assessment is a certain percentage of the fair market value that is determined by local assessors to be the total taxable value of land and additions on the property. | Land | Improvement |
|---|---|---|---|---|
| 2025 | $5,830 | $443,742 | $221,872 | $221,870 |
| 2024 | $5,830 | $435,042 | $217,522 | $217,520 |
| 2023 | $5,725 | $426,514 | $213,258 | $213,256 |
| 2022 | $5,599 | $418,154 | $209,078 | $209,076 |
| 2021 | $5,495 | $409,958 | $204,980 | $204,978 |
| 2020 | $5,535 | $405,758 | $202,880 | $202,878 |
| 2019 | $5,349 | $397,802 | $198,902 | $198,900 |
| 2018 | $4,075 | $295,936 | $147,968 | $147,968 |
| 2017 | $3,727 | $290,134 | $145,067 | $145,067 |
| 2016 | $3,640 | $284,446 | $142,223 | $142,223 |
| 2015 | $3,592 | $280,174 | $140,087 | $140,087 |
| 2014 | $3,498 | $274,686 | $137,343 | $137,343 |
Source: Public Records
Map
Nearby Homes
- 95 Ora Way Unit 303F
- 85 Ora Way Unit 308E
- 55 Ora Way Unit B204
- 45 Ora Way Unit 204A
- 5407 Diamond Heights Blvd Unit 1
- 25 Mizpah St
- 328 Surrey St
- 62 Laidley St
- 30 Harry St
- 43 Sussex St
- 519 30th St
- 838 Duncan St
- 538 28th St
- 524 28th St
- 1731 Noe St
- 479 28th St
- 471-473 30th St
- 246 Bemis St
- 5160 Diamond Heights Blvd Unit 107C
- 5177 Diamond Heights Blvd Unit 113
- 95 Ora Way Unit 109F
- 95 Ora Way Unit 101F
- 95 Ora Way Unit 305f
- 95 Ora Way Unit 301f
- 95 Ora Way Unit 211F
- 95 Ora Way Unit 304F
- 95 Ora Way Unit 309F
- 95 Ora Way Unit F311
- 95 Ora Way Unit F309
- 95 Ora Way Unit F308
- 95 Ora Way Unit F307
- 95 Ora Way Unit F306
- 95 Ora Way Unit F305
- 95 Ora Way Unit F303
- 95 Ora Way Unit F302
- 95 Ora Way Unit F211
- 95 Ora Way Unit F209
- 95 Ora Way Unit F207
- 95 Ora Way Unit F206
- 95 Ora Way Unit F205