95 Silas St Unit 1 Springfield, MA 01109
Pine Point NeighborhoodEstimated Value: $243,000 - $303,000
2
Beds
2
Baths
1,333
Sq Ft
$206/Sq Ft
Est. Value
About This Home
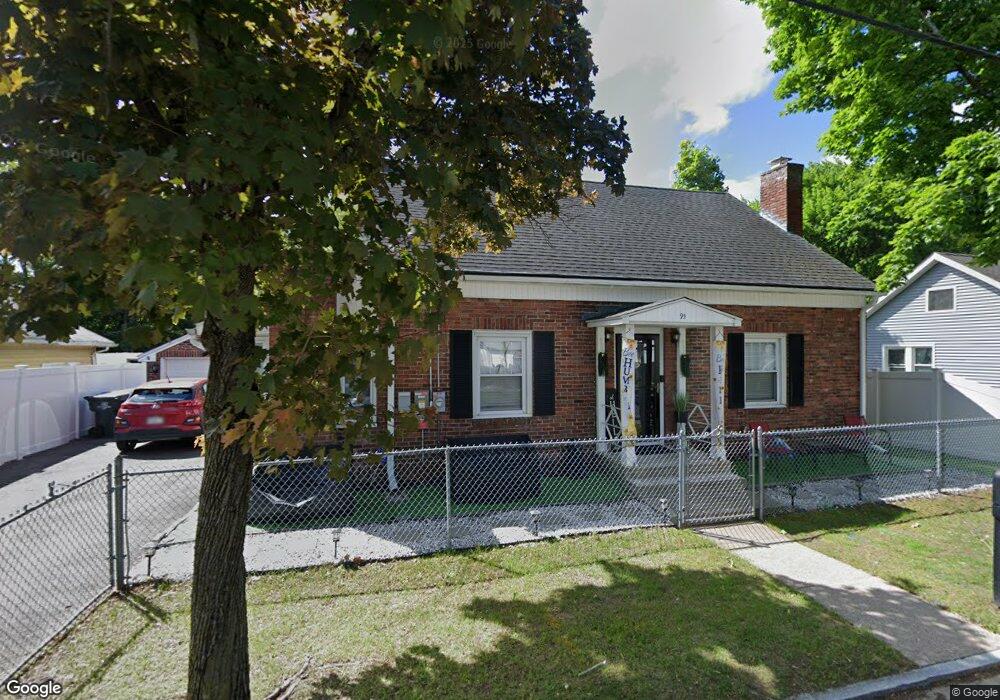
This home is located at 95 Silas St Unit 1, Springfield, MA 01109 and is currently estimated at $274,402, approximately $205 per square foot. 95 Silas St Unit 1 is a home located in Hampden County with nearby schools including Hiram L. Dorman Elementary, John F. Kennedy Academy, and Springfield Central High School.
Ownership History
Date
Name
Owned For
Owner Type
Purchase Details
Closed on
Jun 30, 2016
Sold by
Est Buzzell Joan E and Lefebvre Suzanne L
Bought by
Torres Michelle
Current Estimated Value
Home Financials for this Owner
Home Financials are based on the most recent Mortgage that was taken out on this home.
Original Mortgage
$103,098
Outstanding Balance
$81,289
Interest Rate
3.37%
Mortgage Type
FHA
Estimated Equity
$193,113
Purchase Details
Closed on
Jun 10, 1996
Sold by
Est Braica Louise and Taylor Steven A
Bought by
Brown Barbara A and Buzzell Joan E
Home Financials for this Owner
Home Financials are based on the most recent Mortgage that was taken out on this home.
Original Mortgage
$72,393
Interest Rate
7.89%
Mortgage Type
Purchase Money Mortgage
Create a Home Valuation Report for This Property
The Home Valuation Report is an in-depth analysis detailing your home's value as well as a comparison with similar homes in the area
Home Values in the Area
Average Home Value in this Area
Purchase History
| Date | Buyer | Sale Price | Title Company |
|---|---|---|---|
| Torres Michelle | $105,000 | -- | |
| Brown Barbara A | $74,000 | -- |
Source: Public Records
Mortgage History
| Date | Status | Borrower | Loan Amount |
|---|---|---|---|
| Open | Torres Michelle | $103,098 | |
| Previous Owner | Brown Barbara A | $69,800 | |
| Previous Owner | Brown Barbara A | $72,393 |
Source: Public Records
Tax History Compared to Growth
Tax History
| Year | Tax Paid | Tax Assessment Tax Assessment Total Assessment is a certain percentage of the fair market value that is determined by local assessors to be the total taxable value of land and additions on the property. | Land | Improvement |
|---|---|---|---|---|
| 2025 | $3,721 | $237,300 | $39,700 | $197,600 |
| 2024 | $3,744 | $233,100 | $33,100 | $200,000 |
| 2023 | $3,349 | $196,400 | $30,100 | $166,300 |
| 2022 | $3,341 | $177,500 | $28,100 | $149,400 |
| 2021 | $3,026 | $160,100 | $25,600 | $134,500 |
| 2020 | $2,775 | $142,100 | $25,600 | $116,500 |
| 2019 | $2,647 | $134,500 | $25,600 | $108,900 |
| 2018 | $2,633 | $133,800 | $25,600 | $108,200 |
| 2017 | $2,461 | $125,200 | $23,600 | $101,600 |
| 2016 | $2,159 | $109,800 | $23,600 | $86,200 |
| 2015 | $2,093 | $106,400 | $23,600 | $82,800 |
Source: Public Records
Map
Nearby Homes