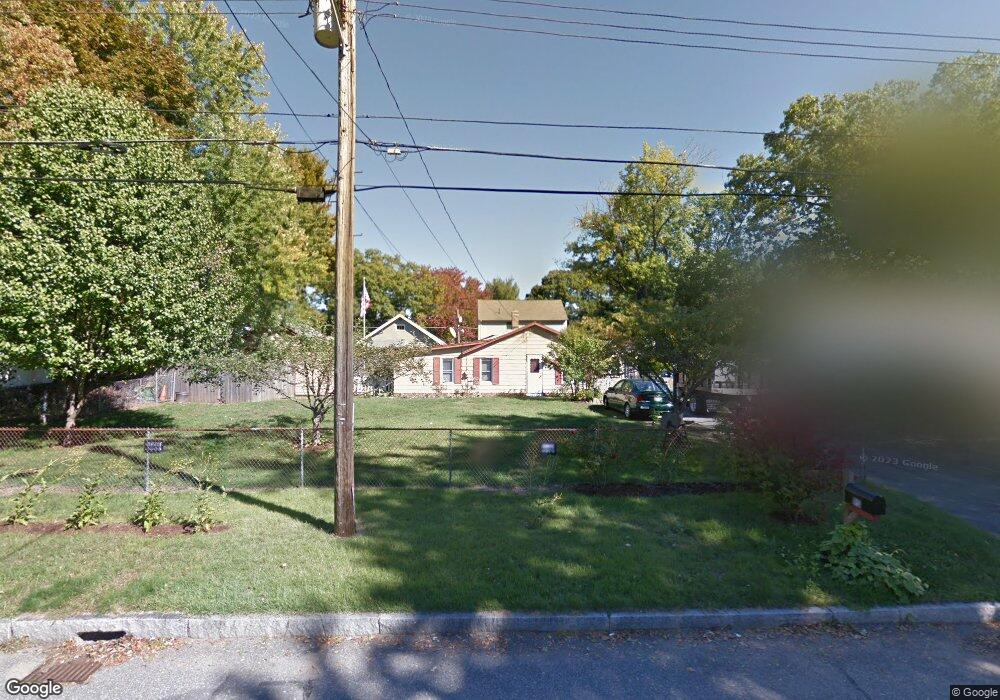
95 Wrentham Rd Springfield, MA 01119
Boston Road NeighborhoodEstimated Value: $235,000 - $288,000
4
Beds
1
Bath
1,110
Sq Ft
$230/Sq Ft
Est. Value
About This Home
This home is located at 95 Wrentham Rd, Springfield, MA 01119 and is currently estimated at $254,921, approximately $229 per square foot. 95 Wrentham Rd is a home located in Hampden County with nearby schools including Warner, M Marcus Kiley Middle, and Springfield Central High School.
Ownership History
Date
Name
Owned For
Owner Type
Purchase Details
Closed on
Mar 18, 2025
Sold by
Swett Wayne T
Bought by
Swett Wayne T and Swett Diana M
Current Estimated Value
Purchase Details
Closed on
Apr 2, 2001
Sold by
Rohan Scott E and Rohan Lucia M
Bought by
Sweet Wayne T
Home Financials for this Owner
Home Financials are based on the most recent Mortgage that was taken out on this home.
Original Mortgage
$74,311
Interest Rate
6.96%
Mortgage Type
Purchase Money Mortgage
Purchase Details
Closed on
Nov 20, 1991
Sold by
Mancinone David E and Mancinone Lisa
Bought by
Rohan Scott E and Newsome Lucia M
Purchase Details
Closed on
Sep 6, 1991
Sold by
Key Fin Serv Inc
Bought by
Mancinone David E and Mancinone Lisa M
Purchase Details
Closed on
Mar 15, 1991
Sold by
Key Fin Serv Inc
Bought by
Key Fin Serv Inc
Purchase Details
Closed on
Mar 3, 1989
Sold by
Casavant Karen A
Bought by
Chiaravalle John L
Purchase Details
Closed on
Feb 10, 1989
Sold by
Goodrow Beatrice R
Bought by
Casavant Karen A
Create a Home Valuation Report for This Property
The Home Valuation Report is an in-depth analysis detailing your home's value as well as a comparison with similar homes in the area
Home Values in the Area
Average Home Value in this Area
Purchase History
| Date | Buyer | Sale Price | Title Company |
|---|---|---|---|
| Swett Wayne T | -- | -- | |
| Swett Wayne T | -- | -- | |
| Sweet Wayne T | $74,899 | -- | |
| Sweet Wayne T | $74,899 | -- | |
| Rohan Scott E | $54,000 | -- | |
| Rohan Scott E | $54,000 | -- | |
| Mancinone David E | $35,000 | -- | |
| Mancinone David E | $35,000 | -- | |
| Key Fin Serv Inc | $63,500 | -- | |
| Key Fin Serv Inc | $63,500 | -- | |
| Chiaravalle John L | $120,000 | -- | |
| Chiaravalle John L | $120,000 | -- | |
| Casavant Karen A | $70,000 | -- | |
| Casavant Karen A | $70,000 | -- |
Source: Public Records
Mortgage History
| Date | Status | Borrower | Loan Amount |
|---|---|---|---|
| Previous Owner | Casavant Karen A | $74,311 |
Source: Public Records
Tax History
| Year | Tax Paid | Tax Assessment Tax Assessment Total Assessment is a certain percentage of the fair market value that is determined by local assessors to be the total taxable value of land and additions on the property. | Land | Improvement |
|---|---|---|---|---|
| 2025 | $2,123 | $135,400 | $43,000 | $92,400 |
| 2024 | $2,104 | $131,000 | $40,200 | $90,800 |
| 2023 | $2,136 | $125,300 | $38,300 | $87,000 |
| 2022 | $1,903 | $101,100 | $38,300 | $62,800 |
| 2021 | $1,705 | $90,200 | $34,800 | $55,400 |
| 2020 | $1,922 | $98,400 | $34,800 | $63,600 |
| 2019 | $1,834 | $93,200 | $34,800 | $58,400 |
| 2018 | $1,653 | $84,000 | $34,800 | $49,200 |
| 2017 | $1,765 | $89,800 | $34,800 | $55,000 |
| 2016 | $1,362 | $69,300 | $34,800 | $34,500 |
| 2015 | $1,353 | $68,800 | $34,800 | $34,000 |
Source: Public Records
Map
Nearby Homes
- 101 Wrentham Rd
- 104 Wrentham Rd
- 102 Wrentham Rd
- 96 Lucerne Rd
- 85 Wrentham Rd
- 105 Wrentham Rd
- 80 Wrentham Rd
- 90 Lucerne Rd
- 100 Lucerne Rd
- 86 Lucerne Rd
- 106 Lucerne Rd
- 81 Wrentham Rd
- 111 Wrentham Rd
- 92 Wrentham Rd
- 80 Lucerne Rd
- 110 Lucerne Rd
- 108 Wrentham Rd
- 86 Wrentham Rd
- 115 Wrentham Rd
- 75 Wrentham Rd
Your Personal Tour Guide
Ask me questions while you tour the home.