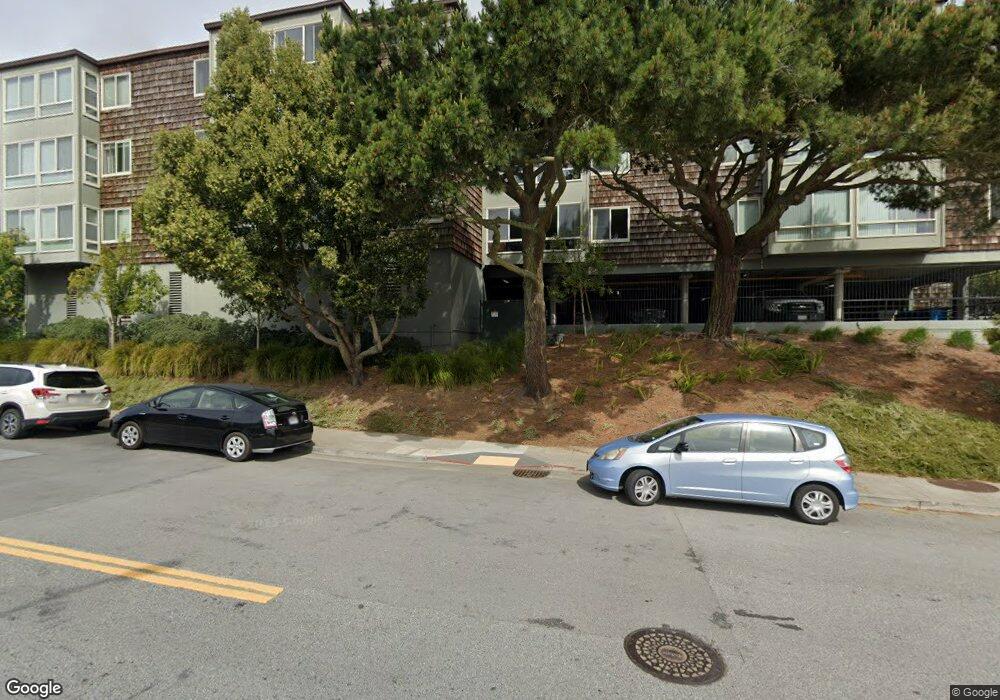
950 Duncan St Unit E207 San Francisco, CA 94131
Diamond Heights NeighborhoodEstimated Value: $521,840 - $638,000
1
Bed
1
Bath
744
Sq Ft
$776/Sq Ft
Est. Value
About This Home
This home is located at 950 Duncan St Unit E207, San Francisco, CA 94131 and is currently estimated at $577,460, approximately $776 per square foot. 950 Duncan St Unit E207 is a home located in San Francisco County with nearby schools including Miraloma Elementary School, Denman (James) Middle School, and St. Philip School.
Ownership History
Date
Name
Owned For
Owner Type
Purchase Details
Closed on
Oct 18, 2011
Sold by
Chan Nadia and Chan Daniel
Bought by
Bautista Baron Marck Co
Current Estimated Value
Home Financials for this Owner
Home Financials are based on the most recent Mortgage that was taken out on this home.
Original Mortgage
$219,000
Outstanding Balance
$149,006
Interest Rate
4.05%
Mortgage Type
New Conventional
Estimated Equity
$428,454
Purchase Details
Closed on
Apr 19, 2005
Sold by
Fabrio Susan and Wilson Susan
Bought by
Chan Daniel and Chan Nadia
Home Financials for this Owner
Home Financials are based on the most recent Mortgage that was taken out on this home.
Original Mortgage
$409,000
Interest Rate
6.37%
Mortgage Type
Purchase Money Mortgage
Purchase Details
Closed on
Feb 5, 2002
Sold by
Kong Christina S
Bought by
Wilson Susan
Create a Home Valuation Report for This Property
The Home Valuation Report is an in-depth analysis detailing your home's value as well as a comparison with similar homes in the area
Home Values in the Area
Average Home Value in this Area
Purchase History
| Date | Buyer | Sale Price | Title Company |
|---|---|---|---|
| Bautista Baron Marck Co | $292,000 | Chicago Title Company | |
| Chan Daniel | $559,000 | Chicago Title Company | |
| Fabrio Susan | -- | Chicago Title Company | |
| Wilson Susan | $277,500 | Fidelity National Title Co |
Source: Public Records
Mortgage History
| Date | Status | Borrower | Loan Amount |
|---|---|---|---|
| Open | Bautista Baron Marck Co | $219,000 | |
| Previous Owner | Chan Daniel | $409,000 | |
| Closed | Chan Daniel | $150,000 |
Source: Public Records
Tax History
| Year | Tax Paid | Tax Assessment Tax Assessment Total Assessment is a certain percentage of the fair market value that is determined by local assessors to be the total taxable value of land and additions on the property. | Land | Improvement |
|---|---|---|---|---|
| 2025 | $5,501 | $414,484 | $257,485 | $156,999 |
| 2024 | $5,501 | $406,358 | $252,437 | $153,921 |
| 2023 | $5,399 | $398,391 | $247,488 | $150,903 |
| 2022 | $5,278 | $390,581 | $242,636 | $147,945 |
| 2021 | $5,179 | $382,924 | $237,879 | $145,045 |
| 2020 | $5,219 | $378,998 | $235,440 | $143,558 |
| 2019 | $5,043 | $371,568 | $230,824 | $140,744 |
| 2018 | $4,874 | $364,284 | $226,299 | $137,985 |
| 2017 | $4,517 | $357,142 | $221,862 | $135,280 |
| 2016 | $4,419 | $350,140 | $217,512 | $132,628 |
| 2015 | $4,361 | $344,881 | $214,245 | $130,636 |
| 2014 | $4,247 | $338,127 | $210,049 | $128,078 |
Source: Public Records
Map
Nearby Homes
- 5160 Diamond Heights Blvd Unit 107C
- 55 Red Rock Way Unit 110O
- 970 Duncan St Unit 207F
- 5177 Diamond Heights Blvd Unit 113
- 95 Red Rock Way Unit 203M
- 15 Red Rock Way Unit N207
- 15 Red Rock Way Unit 202N
- 990 Duncan St Unit 302G
- 5140 Diamond Heights Blvd Unit 203A
- 266 Red Rock Way Unit A
- 5080 Diamond Heights Blvd Unit A
- 12 Amber Dr Unit 24
- 5004 Diamond Heights Blvd Unit 2
- 752 Duncan St
- 5320 Diamond Heights Blvd Unit 202K
- 4519 25th St Unit B
- 980 Burnett Ave
- 5330 Diamond Heights Blvd Unit J301
- 249 Gold Mine Dr
- 647 Grand View Ave Unit 4
- 950 Duncan St Unit E208
- 950 Duncan St Unit E303
- 950 Duncan St Unit E302
- 950 Duncan St Unit E-202
- 950 Duncan St Unit E205
- 950 Duncan St Unit E-206
- 950 Duncan St Unit E104
- 950 Duncan St Unit E102
- 950 Duncan St Unit E101
- 950 Duncan St Unit E305
- 950 Duncan St Unit E304
- 950 Duncan St Unit E201
- 950 Duncan St Unit e-205
- 950 Duncan St Unit E-107
- 950 Duncan St Unit E108
- 950 Duncan St Unit E307
- 950 Duncan St Unit E-207
- 950 Duncan St Unit E204
- 950 Duncan St Unit E105
- 950 Duncan St Unit E103
Your Personal Tour Guide
Ask me questions while you tour the home.