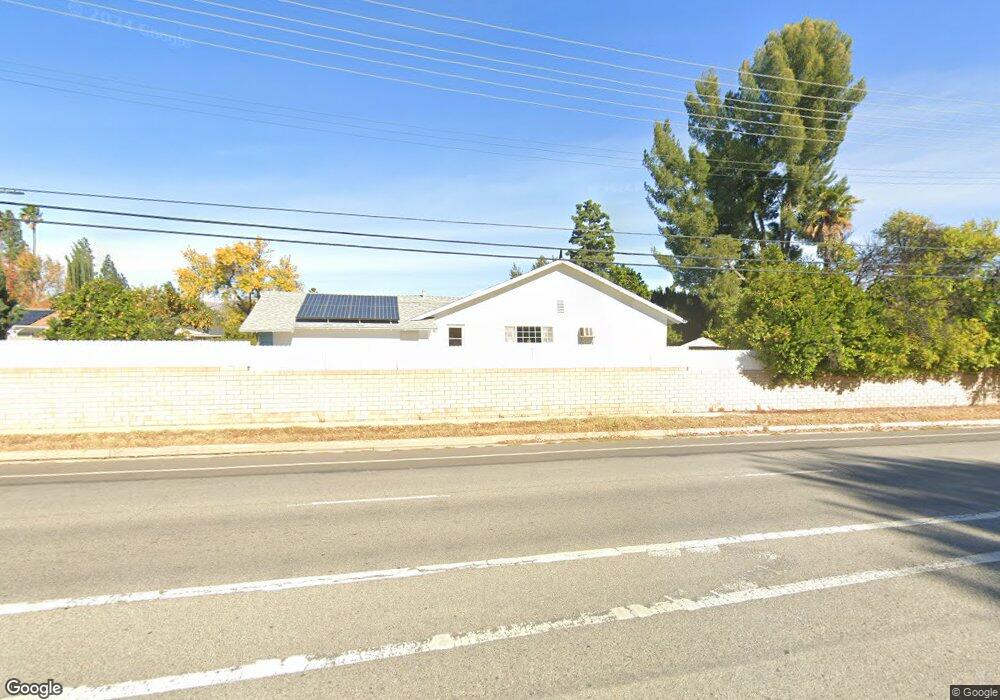
9504 Sylvia Ave Northridge, CA 91324
Estimated Value: $1,174,000 - $1,317,000
4
Beds
3
Baths
2,051
Sq Ft
$595/Sq Ft
Est. Value
About This Home
This home is located at 9504 Sylvia Ave, Northridge, CA 91324 and is currently estimated at $1,220,069, approximately $594 per square foot. 9504 Sylvia Ave is a home located in Los Angeles County with nearby schools including Topeka Charter School For Advanced Studies, Calahan Street Elementary, and Our Community School.
Ownership History
Date
Name
Owned For
Owner Type
Purchase Details
Closed on
May 24, 2004
Sold by
Desantis James V and Desantis Joann R
Bought by
Desantis James V and Desantis Joann R
Current Estimated Value
Purchase Details
Closed on
Apr 30, 2003
Sold by
Desantis James V and Desantis Joann Ruth
Bought by
Desantis James V and Desantis Joann R
Purchase Details
Closed on
Apr 4, 2002
Sold by
Desantis James V and Desantis Joanne R
Bought by
Desantis James V and Desantis Joann Ruth
Purchase Details
Closed on
Mar 24, 1999
Sold by
Desantis James V and Desantis 1996 Trust
Bought by
Desantis James V and Desantis Joann R
Home Financials for this Owner
Home Financials are based on the most recent Mortgage that was taken out on this home.
Original Mortgage
$167,500
Interest Rate
6.73%
Purchase Details
Closed on
Aug 16, 1996
Sold by
Desantis James V and Desantis Joann R
Bought by
Desantis James V and Desantis Joann Ruth
Create a Home Valuation Report for This Property
The Home Valuation Report is an in-depth analysis detailing your home's value as well as a comparison with similar homes in the area
Home Values in the Area
Average Home Value in this Area
Purchase History
| Date | Buyer | Sale Price | Title Company |
|---|---|---|---|
| Desantis James V | -- | -- | |
| Desantis James V | -- | Commonwealth Land Title | |
| Desantis James V | -- | -- | |
| Desantis James V | -- | Commonwealth Title | |
| Desantis James V | -- | -- |
Source: Public Records
Mortgage History
| Date | Status | Borrower | Loan Amount |
|---|---|---|---|
| Closed | Desantis James V | $167,500 |
Source: Public Records
Tax History Compared to Growth
Tax History
| Year | Tax Paid | Tax Assessment Tax Assessment Total Assessment is a certain percentage of the fair market value that is determined by local assessors to be the total taxable value of land and additions on the property. | Land | Improvement |
|---|---|---|---|---|
| 2025 | $2,457 | $171,314 | $48,510 | $122,804 |
| 2024 | $2,457 | $167,956 | $47,559 | $120,397 |
| 2023 | $2,417 | $164,664 | $46,627 | $118,037 |
| 2022 | $2,320 | $161,436 | $45,713 | $115,723 |
| 2021 | $2,282 | $158,271 | $44,817 | $113,454 |
| 2019 | $2,222 | $153,579 | $43,489 | $110,090 |
| 2018 | $2,086 | $150,569 | $42,637 | $107,932 |
| 2016 | $1,975 | $144,724 | $40,982 | $103,742 |
| 2015 | $1,950 | $142,551 | $40,367 | $102,184 |
| 2014 | $1,967 | $139,760 | $39,577 | $100,183 |
Source: Public Records
Map
Nearby Homes
- 19200 Ballinger St
- 19128 Prairie St
- 19523 Ballinger St
- 9251 Wystone Ave
- 9301 Shirley Ave Unit 70
- 9819 Vanalden Ave
- 19505 Cardigan Dr
- 18839 Plummer St
- 19513 Astor Place
- 19621 Citronia St
- 19029 Nordhoff St Unit 103
- 19029 Nordhoff St Unit 308
- 19029 Nordhoff St Unit 108
- 9701 Bothwell Rd
- 9000 Vanalden Ave Unit 179
- 9000 Vanalden Ave Unit 150
- 9000 Vanalden Ave Unit 197
- 1 Heather Ln
- 19651 Marilla St
- 9625 Yolanda Ave
- 9510 Sylvia Ave
- 9507 Beckford Ave
- 9455 Beckford Ave
- 9520 Sylvia Ave
- 9515 Beckford Ave
- 19240 Ballinger St
- 9505 Sylvia Ave
- 9454 Beckford Ave
- 19210 Ballinger St
- 9445 Beckford Ave
- 9462 Tampa Ave
- 9444 Beckford Ave
- 19252 Ballinger St
- 9456 Tampa Ave
- 9435 Beckford Ave
- 19231 Ballinger St
- 19241 Ballinger St
- 9450 Tampa Ave
- 9508 Beckford Ave
- 9455 Claire Ave