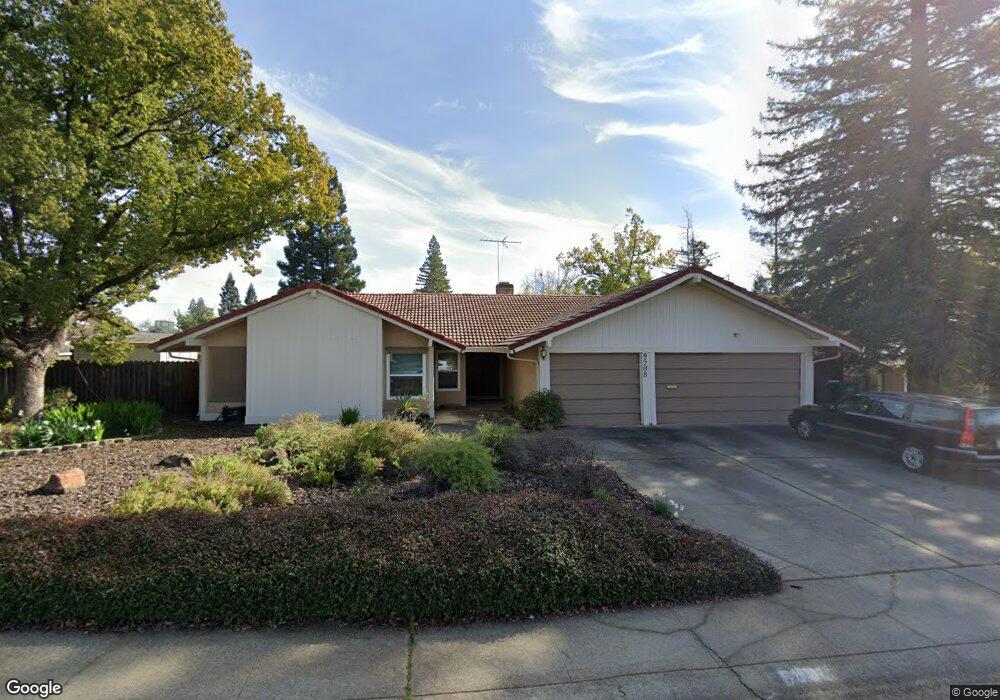
9508 Flintridge Way Orangevale, CA 95662
Estimated Value: $388,000 - $669,000
4
Beds
2
Baths
1,770
Sq Ft
$331/Sq Ft
Est. Value
About This Home
This home is located at 9508 Flintridge Way, Orangevale, CA 95662 and is currently estimated at $586,242, approximately $331 per square foot. 9508 Flintridge Way is a home located in Sacramento County with nearby schools including Twin Lakes Elementary School, Andrew Carnegie Middle School, and Bella Vista High School.
Ownership History
Date
Name
Owned For
Owner Type
Purchase Details
Closed on
May 21, 2014
Sold by
Blakley William G and Blakley Corinne S
Bought by
The Blakley Family Trust
Current Estimated Value
Purchase Details
Closed on
Mar 12, 2010
Sold by
Arney Peter Wyckoff and Arney Peter
Bought by
Blakley William G and Blakley Corinne S
Home Financials for this Owner
Home Financials are based on the most recent Mortgage that was taken out on this home.
Original Mortgage
$110,000
Interest Rate
5%
Mortgage Type
New Conventional
Purchase Details
Closed on
Jan 3, 2001
Sold by
Trust Peter & Charlotte Arney Family 1997 and Wyckoff Arney Peter
Bought by
Arney Peter Wyckoff and Arney Peter
Purchase Details
Closed on
Feb 14, 1997
Sold by
Arney Peter W and Arney Charlotte S
Bought by
Arney Peter Wyckoff and Arney Charlotte Sue
Create a Home Valuation Report for This Property
The Home Valuation Report is an in-depth analysis detailing your home's value as well as a comparison with similar homes in the area
Home Values in the Area
Average Home Value in this Area
Purchase History
| Date | Buyer | Sale Price | Title Company |
|---|---|---|---|
| The Blakley Family Trust | -- | None Available | |
| Blakley William G | $290,000 | Chicago Title Company | |
| Arney Peter Wyckoff | -- | -- | |
| Arney Peter Wyckoff | -- | -- |
Source: Public Records
Mortgage History
| Date | Status | Borrower | Loan Amount |
|---|---|---|---|
| Closed | Blakley William G | $110,000 |
Source: Public Records
Tax History Compared to Growth
Tax History
| Year | Tax Paid | Tax Assessment Tax Assessment Total Assessment is a certain percentage of the fair market value that is determined by local assessors to be the total taxable value of land and additions on the property. | Land | Improvement |
|---|---|---|---|---|
| 2025 | $4,389 | $374,324 | $180,708 | $193,616 |
| 2024 | $4,389 | $366,985 | $177,165 | $189,820 |
| 2023 | $4,278 | $359,791 | $173,692 | $186,099 |
| 2022 | $4,254 | $352,737 | $170,287 | $182,450 |
| 2021 | $4,183 | $345,822 | $166,949 | $178,873 |
| 2020 | $4,105 | $342,277 | $165,238 | $177,039 |
| 2019 | $4,022 | $335,567 | $161,999 | $173,568 |
| 2018 | $3,975 | $328,988 | $158,823 | $170,165 |
| 2017 | $3,935 | $322,538 | $155,709 | $166,829 |
| 2016 | $3,677 | $316,214 | $152,656 | $163,558 |
| 2015 | $3,614 | $311,465 | $150,363 | $161,102 |
| 2014 | $3,538 | $305,365 | $147,418 | $157,947 |
Source: Public Records
Map
Nearby Homes
- 5168 Mississippi Bar Dr
- 9391 Rolling Glen Ct
- 9514 Bullion Way
- 9412 Twin Lakes Ave
- 5312 Tall Oak Ln
- 9196 Rolling Tree Ln
- 9429 Erwin Ave
- 9160 Madison Ave Unit 57
- 9160 Madison Ave Unit 44
- 5601 Walnut Ave Unit 4
- 5601 Spindrift Ln
- 5607 Walnut Ave Unit 10
- 9150 Green Ravine Ln
- 9709 Snowberry Way
- 9215 Madison Ave
- 9237 Madison Ave
- 9260 Castlemont Cir
- 9487 Dalton Way
- 9172 Madison Green Ln Unit 49
- 9085 Hangar Way
- 9510 Flintridge Way
- 9504 Flintridge Way
- 9862 Golden Dr
- 9856 Golden Dr
- 9509 Flintridge Way
- 9512 Flintridge Way
- 9507 Flintridge Way
- 9511 Flintridge Way
- 9500 Flintridge Way
- 9505 Flintridge Way
- 9850 Golden Dr
- 9513 Flintridge Way
- 9503 Flintridge Way
- 9516 Flintridge Way
- 9884 Golden Dr
- 9844 Golden Dr
- 9517 Flintridge Way
- 9506 Winterbrook Way
- 5212 Dredger Way
- 5216 Dredger Way