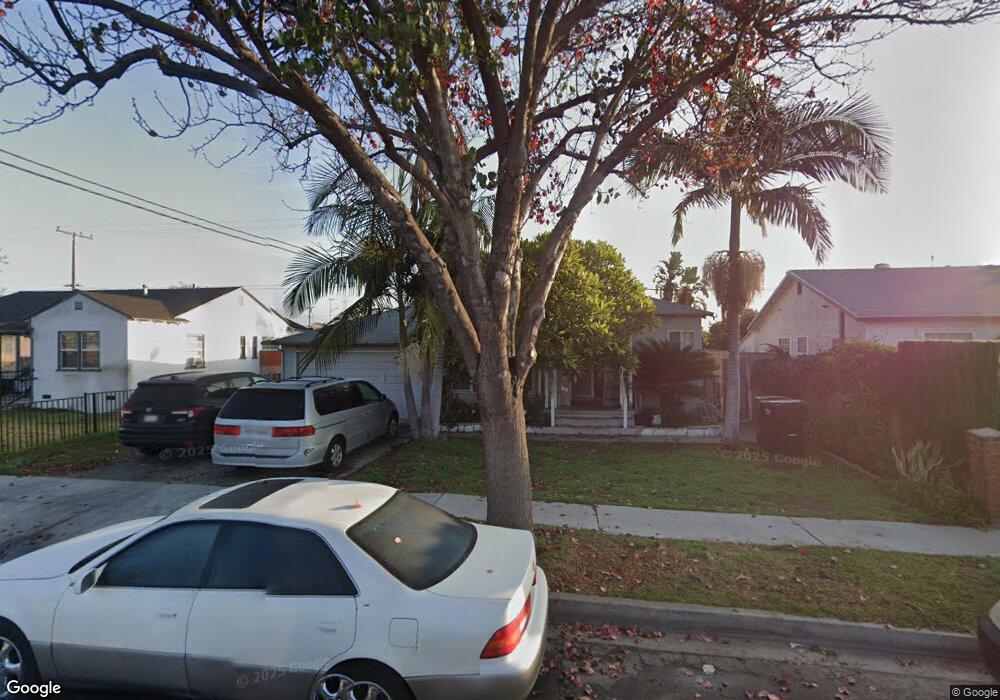
9509 Brierfield St Pico Rivera, CA 90660
Estimated Value: $734,000 - $793,000
3
Beds
2
Baths
1,366
Sq Ft
$559/Sq Ft
Est. Value
About This Home
This home is located at 9509 Brierfield St, Pico Rivera, CA 90660 and is currently estimated at $763,387, approximately $558 per square foot. 9509 Brierfield St is a home located in Los Angeles County with nearby schools including Durfee Elementary School, North Park Middle School, and El Rancho High School.
Ownership History
Date
Name
Owned For
Owner Type
Purchase Details
Closed on
Apr 25, 2025
Sold by
Lopez Guillermina
Bought by
Lopez Guillermina
Current Estimated Value
Home Financials for this Owner
Home Financials are based on the most recent Mortgage that was taken out on this home.
Original Mortgage
$1,095,000
Outstanding Balance
$1,090,130
Interest Rate
6.64%
Mortgage Type
Reverse Mortgage Home Equity Conversion Mortgage
Estimated Equity
-$326,743
Purchase Details
Closed on
Jan 30, 2008
Sold by
Lopez Ramon
Bought by
Lopez Ramon
Purchase Details
Closed on
Apr 18, 2007
Sold by
Lopez Guillermina
Bought by
Lopez Ramon
Home Financials for this Owner
Home Financials are based on the most recent Mortgage that was taken out on this home.
Original Mortgage
$245,000
Interest Rate
6.15%
Mortgage Type
New Conventional
Create a Home Valuation Report for This Property
The Home Valuation Report is an in-depth analysis detailing your home's value as well as a comparison with similar homes in the area
Home Values in the Area
Average Home Value in this Area
Purchase History
| Date | Buyer | Sale Price | Title Company |
|---|---|---|---|
| Lopez Guillermina | -- | Placer Title Company | |
| Lopez Ramon | -- | None Available | |
| Lopez Ramon | -- | Southland Title Company |
Source: Public Records
Mortgage History
| Date | Status | Borrower | Loan Amount |
|---|---|---|---|
| Open | Lopez Guillermina | $1,095,000 | |
| Closed | Lopez Guillermina | $1,095,000 | |
| Previous Owner | Lopez Ramon | $245,000 |
Source: Public Records
Tax History Compared to Growth
Tax History
| Year | Tax Paid | Tax Assessment Tax Assessment Total Assessment is a certain percentage of the fair market value that is determined by local assessors to be the total taxable value of land and additions on the property. | Land | Improvement |
|---|---|---|---|---|
| 2025 | $4,450 | $300,882 | $161,794 | $139,088 |
| 2024 | $4,450 | $294,983 | $158,622 | $136,361 |
| 2023 | $4,328 | $289,200 | $155,512 | $133,688 |
| 2022 | $4,134 | $283,530 | $152,463 | $131,067 |
| 2021 | $4,020 | $277,972 | $149,474 | $128,498 |
| 2019 | $3,989 | $269,730 | $145,042 | $124,688 |
| 2018 | $3,779 | $264,443 | $142,199 | $122,244 |
| 2016 | $3,413 | $254,177 | $136,678 | $117,499 |
| 2015 | $3,361 | $250,360 | $134,625 | $115,735 |
| 2014 | $3,321 | $245,456 | $131,988 | $113,468 |
Source: Public Records
Map
Nearby Homes
- 3551 Sandoval Ave
- 3602 Greenglade Ave
- 3754 Durfee Ave
- 9900 Tagus St Unit 30
- 9943 Noyes St
- 4044 Rosemead Blvd Unit 54
- 3684 Elford Dr
- 0 San Gabriel River Pkwy
- 4115 Rosemead Blvd
- 8939 Gallatin Rd Unit 47
- 5523 Pioneer Blvd Unit 30
- 8509 Beverly Blvd
- 5577 Pioneer Blvd Unit 5
- 9335 Via Azul
- 9339 Via Azul
- 4568 Los Toros Ave
- 5107 Vista Verde Way
- Plan 1560 at Azul
- Plan 1680 at Azul
- Plan 1706 Modeled at Azul
- 9503 Brierfield St
- 9513 Brierfield St
- 9519 Brierfield St
- 9506 Brierfield St
- 9512 Brierfield St
- 9502 Brierfield St
- 9518 Brierfield St
- 3603 Sandoval Ave
- 3607 Sandoval Ave
- 3557 Sandoval Ave
- 3613 Sandoval Ave
- 9524 Brierfield St
- 9531 Brierfield St
- 3619 Sandoval Ave
- 9509 Danville St
- 9513 Danville St
- 9503 Danville St
- 3545 Sandoval Ave
- 9519 Danville St
- 9528 Brierfield St