Estimated Value: $515,981 - $540,000
3
Beds
3
Baths
2,212
Sq Ft
$239/Sq Ft
Est. Value
About This Home
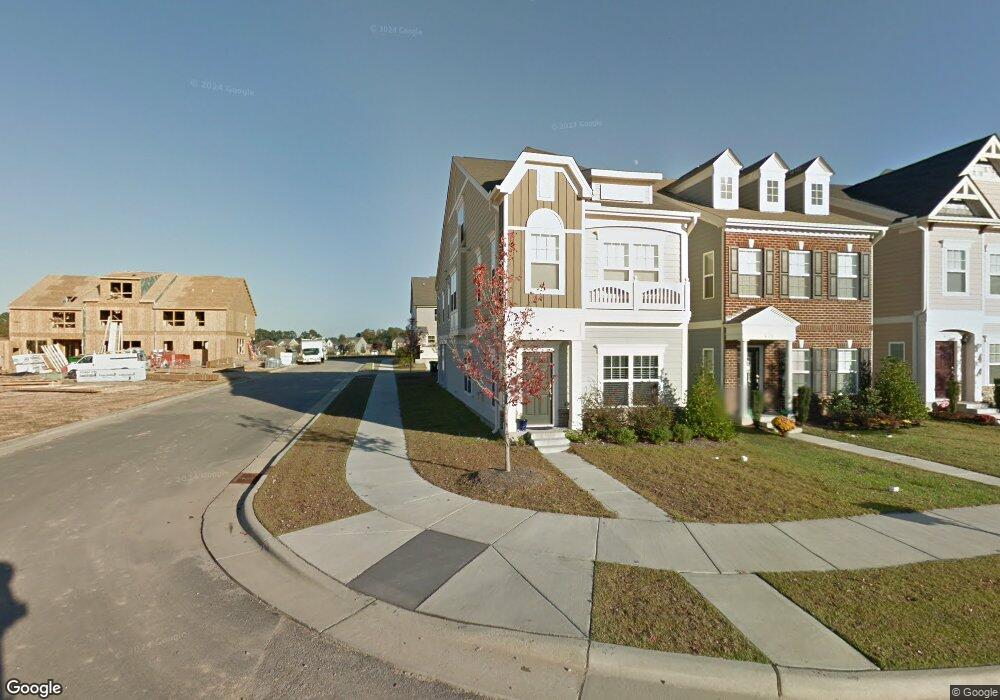
This home is located at 951 Branch Line Ln, Apex, NC 27502 and is currently estimated at $527,745, approximately $238 per square foot. 951 Branch Line Ln is a home located in Wake County with nearby schools including Salem Elementary, Salem Middle, and Apex High School.
Ownership History
Date
Name
Owned For
Owner Type
Purchase Details
Closed on
Mar 11, 2025
Sold by
Dekraker Christine Marie and Tyburski Christine D
Bought by
Christine M Dekraker Trust and Dekraker
Current Estimated Value
Purchase Details
Closed on
Mar 18, 2011
Sold by
Tyburski Jeffrey B
Bought by
Tyburski Christine D
Home Financials for this Owner
Home Financials are based on the most recent Mortgage that was taken out on this home.
Original Mortgage
$181,080
Interest Rate
4.82%
Mortgage Type
New Conventional
Purchase Details
Closed on
Jan 21, 2011
Sold by
Experienceone Homes Llc
Bought by
Tyburski Christine D
Home Financials for this Owner
Home Financials are based on the most recent Mortgage that was taken out on this home.
Original Mortgage
$181,080
Interest Rate
4.82%
Mortgage Type
New Conventional
Create a Home Valuation Report for This Property
The Home Valuation Report is an in-depth analysis detailing your home's value as well as a comparison with similar homes in the area
Home Values in the Area
Average Home Value in this Area
Purchase History
| Date | Buyer | Sale Price | Title Company |
|---|---|---|---|
| Christine M Dekraker Trust | -- | None Listed On Document | |
| Tyburski Christine D | -- | None Available | |
| Tyburski Christine D | $227,000 | None Available |
Source: Public Records
Mortgage History
| Date | Status | Borrower | Loan Amount |
|---|---|---|---|
| Previous Owner | Tyburski Christine D | $181,080 |
Source: Public Records
Tax History Compared to Growth
Tax History
| Year | Tax Paid | Tax Assessment Tax Assessment Total Assessment is a certain percentage of the fair market value that is determined by local assessors to be the total taxable value of land and additions on the property. | Land | Improvement |
|---|---|---|---|---|
| 2025 | $4,215 | $480,514 | $105,000 | $375,514 |
| 2024 | $4,121 | $480,514 | $105,000 | $375,514 |
| 2023 | $3,525 | $319,477 | $60,000 | $259,477 |
| 2022 | $3,309 | $319,477 | $60,000 | $259,477 |
| 2021 | $3,183 | $319,477 | $60,000 | $259,477 |
| 2020 | $3,151 | $319,477 | $60,000 | $259,477 |
| 2019 | $2,790 | $243,907 | $60,000 | $183,907 |
| 2018 | $2,628 | $243,907 | $60,000 | $183,907 |
| 2017 | $2,447 | $243,907 | $60,000 | $183,907 |
| 2016 | $2,412 | $243,907 | $60,000 | $183,907 |
| 2015 | $2,369 | $233,850 | $68,000 | $165,850 |
| 2014 | $2,284 | $233,850 | $68,000 | $165,850 |
Source: Public Records
Map
Nearby Homes
- 953 Ambergate Station
- 919 Branch Line Ln
- 996 Tender Dr
- 1111 Platform Dr
- 1115 Platform Dr
- 1808 N Salem St
- 903 Norwood Ln
- 1003 Lathrop Ln
- 1000 Oakgate Ct
- 596 Grand Central Station
- 810 Richmont Grove Ln
- 823 Richmont Grove Ln
- 547 Grand Central Station
- 904 Dalton Ridge Place
- 1002 Eastham Dr
- 303 Knightsborough Way
- 4006 New Yarmouth Way
- 958 Bay Bouquet Ln
- 907 Haddon Hall Dr
- 612 Cable Ct
- 955 Branch Line Ln
- 957 Branch Line Ln
- 959 Branch Line Ln
- 941 Branch Line Ln
- 937 Branch Line Ln
- 963 Branch Line Ln
- 967 Branch Line Ln
- 933 Branch Line Ln
- 950 Ambergate Station Unit 216
- 950 Ambergate Station
- 952 Ambergate Station
- 954 Ambergate Station
- 956 Ambergate Station
- 969 Branch Line Ln
- 929 Branch Line Ln
- 958 Ambergate Station
- 932 Ambergate Station
- 950 Branch Line Ln
- 960 Ambergate Station
- 946 Branch Line Ln