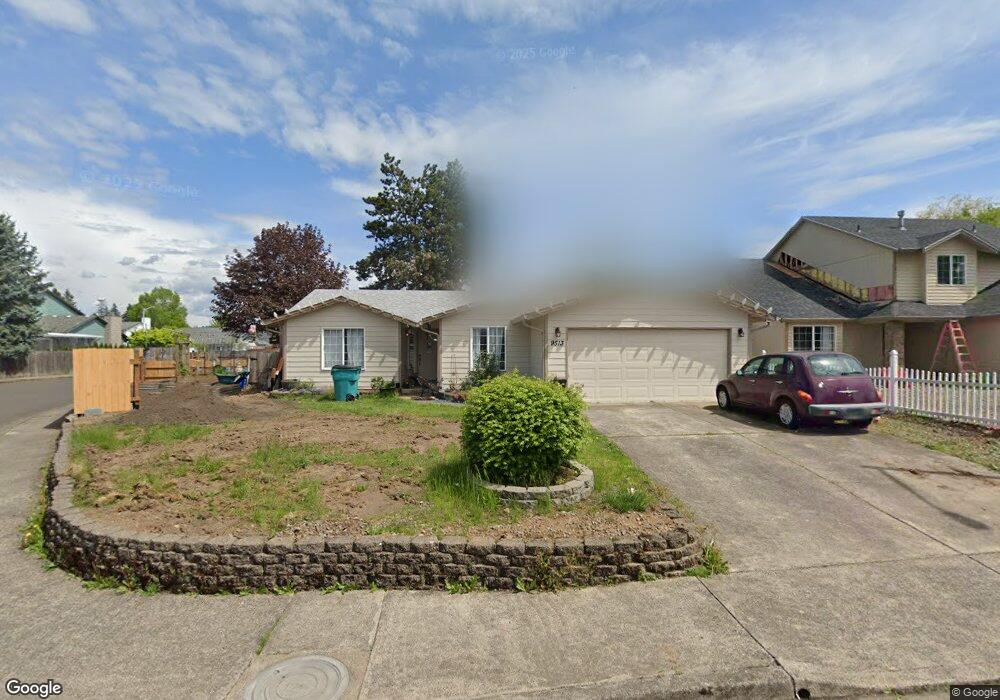
9513 NE 131st Ave Vancouver, WA 98682
North Sifton-Orchards NeighborhoodEstimated Value: $456,000 - $482,000
3
Beds
2
Baths
1,338
Sq Ft
$352/Sq Ft
Est. Value
About This Home
This home is located at 9513 NE 131st Ave, Vancouver, WA 98682 and is currently estimated at $470,915, approximately $351 per square foot. 9513 NE 131st Ave is a home located in Clark County with nearby schools including Sifton Elementary School, Frontier Middle School, and Heritage High School.
Ownership History
Date
Name
Owned For
Owner Type
Purchase Details
Closed on
Sep 2, 2021
Sold by
Wilson Margaret E and Wilson Family Living Trust
Bought by
Jenkins David and Jenkins Jannifer
Current Estimated Value
Home Financials for this Owner
Home Financials are based on the most recent Mortgage that was taken out on this home.
Original Mortgage
$149,012
Outstanding Balance
$135,590
Interest Rate
2.8%
Mortgage Type
FHA
Estimated Equity
$335,325
Purchase Details
Closed on
Feb 4, 2015
Sold by
Wilson Robert D and Wilson Margaret E
Bought by
Wilson Family Living Trust and Wilson Margaret E
Purchase Details
Closed on
Oct 2, 2002
Sold by
Roberts Richard W and Roberts Nancy L
Bought by
Wilson Robert D and Wilson Margaret E
Home Financials for this Owner
Home Financials are based on the most recent Mortgage that was taken out on this home.
Original Mortgage
$131,850
Interest Rate
6.17%
Purchase Details
Closed on
Jan 4, 1995
Sold by
Lafoon Barbara A and Blank Michael H
Bought by
Roberts Richard W and Roberts Nancy L
Home Financials for this Owner
Home Financials are based on the most recent Mortgage that was taken out on this home.
Original Mortgage
$91,200
Interest Rate
7.36%
Create a Home Valuation Report for This Property
The Home Valuation Report is an in-depth analysis detailing your home's value as well as a comparison with similar homes in the area
Home Values in the Area
Average Home Value in this Area
Purchase History
| Date | Buyer | Sale Price | Title Company |
|---|---|---|---|
| Jenkins David | $136,343 | First American Title Ins Co | |
| Wilson Family Living Trust | -- | None Available | |
| Wilson Robert D | $146,550 | Clark County Title | |
| Roberts Richard W | $117,267 | -- |
Source: Public Records
Mortgage History
| Date | Status | Borrower | Loan Amount |
|---|---|---|---|
| Open | Jenkins David | $149,012 | |
| Previous Owner | Wilson Robert D | $131,850 | |
| Previous Owner | Roberts Richard W | $91,200 |
Source: Public Records
Tax History Compared to Growth
Tax History
| Year | Tax Paid | Tax Assessment Tax Assessment Total Assessment is a certain percentage of the fair market value that is determined by local assessors to be the total taxable value of land and additions on the property. | Land | Improvement |
|---|---|---|---|---|
| 2025 | $4,512 | $442,592 | $179,550 | $263,042 |
| 2024 | $4,163 | $443,884 | $179,550 | $264,334 |
| 2023 | $4,169 | $429,567 | $179,550 | $250,017 |
| 2022 | $3,786 | $423,775 | $179,550 | $244,225 |
| 2021 | $3,580 | $358,182 | $153,900 | $204,282 |
| 2020 | $3,316 | $318,595 | $135,000 | $183,595 |
| 2019 | $3,028 | $296,031 | $123,750 | $172,281 |
| 2018 | $3,224 | $291,711 | $0 | $0 |
| 2017 | $2,927 | $250,469 | $0 | $0 |
| 2016 | $2,851 | $236,270 | $0 | $0 |
| 2015 | $2,727 | $214,394 | $0 | $0 |
| 2014 | -- | $195,055 | $0 | $0 |
| 2013 | -- | $161,658 | $0 | $0 |
Source: Public Records
Map
Nearby Homes
- 13008 NE 93rd St
- 10004 NE 133rd Ave
- 10005 NE 133rd Ave
- 13503 NE 89th St
- 10103 NE 134th Ave
- 13423 NE 87th St
- 12813 NE 102nd St
- 12805 NE 102nd St
- 10107 NE 136th Ave
- 13430 NE 86th St Unit Lot 146
- 10234 NE 132nd Place
- 11108 NE 131st Ave
- 11112 NE 131st Ave
- 13508 NE 86th St Unit Lot 150
- 13520 NE 86th St Unit Lot 153
- 13500 NE 86th St Unit Lot 148
- 13504 NE 86th St Unit 149
- 13512 NE 86th St Unit Lot 151
- 13711 NE 101st Dr
- 8517 NE 133rd Ave Unit Lot 92
- 9509 NE 131st Ave
- 9414 NE 132nd Ave
- 9412 NE 132nd Ave
- 9412 NE 132nd Ave
- 9603 NE 131st Ave
- 9505 NE 131st Ave
- 9406 NE 132nd Ave
- 13021 NE 96th St
- 9504 NE 132nd Ave
- 13020 NE 96th St
- 9402 NE 132nd Ave
- 9607 NE 131st Ave
- 9503 NE 131st Ave
- 9506 NE 131st Ave
- 13019 NE 96th St
- 9510 NE 132nd Ave
- 13018 NE 96th St
- 9411 NE 132nd Ave
- 13018 NE 95th St
- 9407 NE 132nd Ave