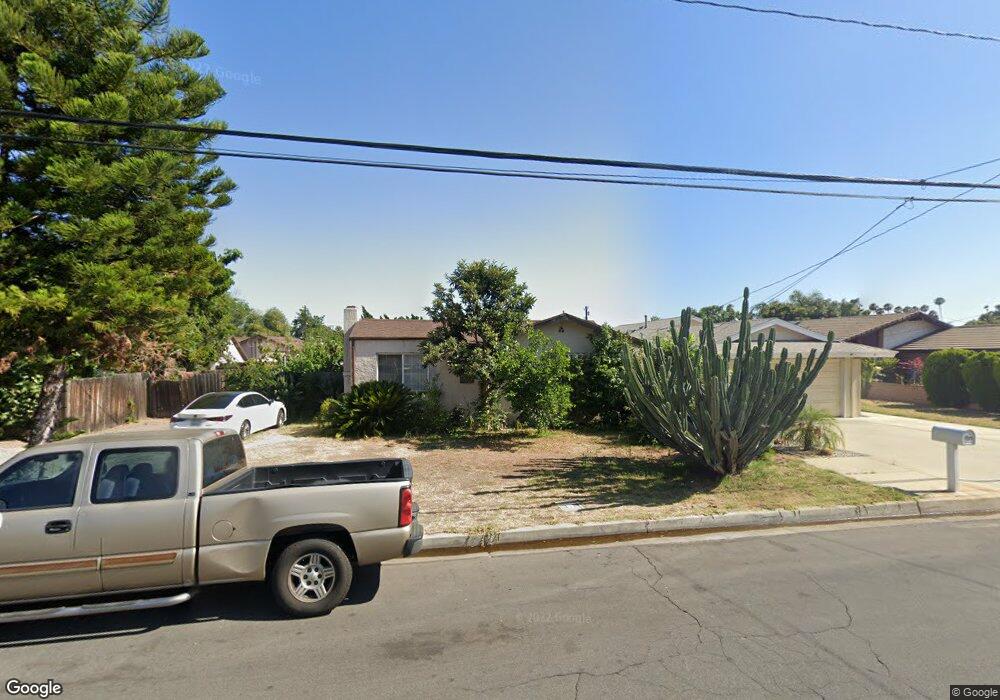
9514 E Naomi Ave Arcadia, CA 91007
Estimated Value: $1,131,020 - $1,328,000
3
Beds
2
Baths
1,481
Sq Ft
$832/Sq Ft
Est. Value
About This Home
This home is located at 9514 E Naomi Ave, Arcadia, CA 91007 and is currently estimated at $1,232,255, approximately $832 per square foot. 9514 E Naomi Ave is a home located in Los Angeles County with nearby schools including Longden Elementary School, Oak Avenue Intermediate School, and Temple City High School.
Ownership History
Date
Name
Owned For
Owner Type
Purchase Details
Closed on
Sep 24, 2009
Sold by
Vanlong Kim and The Long Van Living Trust 2007
Bought by
Vanlong Kim
Current Estimated Value
Home Financials for this Owner
Home Financials are based on the most recent Mortgage that was taken out on this home.
Original Mortgage
$403,900
Outstanding Balance
$262,669
Interest Rate
5.08%
Mortgage Type
New Conventional
Estimated Equity
$969,586
Purchase Details
Closed on
Sep 29, 2008
Sold by
Vanlong Kim and The Long Van Living Trust 2007
Bought by
Vanlong Kim and The Long Van Living Trust
Purchase Details
Closed on
Mar 15, 2007
Sold by
Vanlong Kim
Bought by
Vanlong Kim and Long Van Living Trust 2007
Purchase Details
Closed on
Feb 24, 2003
Sold by
Chen Bing Cheng and Chen Jenny
Bought by
Vanlong Kim
Home Financials for this Owner
Home Financials are based on the most recent Mortgage that was taken out on this home.
Original Mortgage
$300,000
Interest Rate
5.82%
Create a Home Valuation Report for This Property
The Home Valuation Report is an in-depth analysis detailing your home's value as well as a comparison with similar homes in the area
Home Values in the Area
Average Home Value in this Area
Purchase History
| Date | Buyer | Sale Price | Title Company |
|---|---|---|---|
| Vanlong Kim | -- | Pacific Coast Title Company | |
| Vanlong Kim | -- | None Available | |
| Vanlong Kim | -- | None Available | |
| Vanlong Kim | $410,000 | First Southwestern Title Co |
Source: Public Records
Mortgage History
| Date | Status | Borrower | Loan Amount |
|---|---|---|---|
| Open | Vanlong Kim | $403,900 | |
| Closed | Vanlong Kim | $300,000 |
Source: Public Records
Tax History
| Year | Tax Paid | Tax Assessment Tax Assessment Total Assessment is a certain percentage of the fair market value that is determined by local assessors to be the total taxable value of land and additions on the property. | Land | Improvement |
|---|---|---|---|---|
| 2025 | $8,213 | $685,407 | $535,501 | $149,906 |
| 2024 | $8,213 | $671,968 | $525,001 | $146,967 |
| 2023 | $8,028 | $658,793 | $514,707 | $144,086 |
| 2022 | $7,515 | $645,876 | $504,615 | $141,261 |
| 2021 | $7,652 | $633,213 | $494,721 | $138,492 |
| 2020 | $7,545 | $626,721 | $489,649 | $137,072 |
| 2019 | $7,379 | $614,434 | $480,049 | $134,385 |
| 2018 | $7,196 | $602,387 | $470,637 | $131,750 |
| 2016 | $6,898 | $578,997 | $452,362 | $126,635 |
| 2015 | $6,782 | $570,301 | $445,568 | $124,733 |
| 2014 | $6,684 | $559,130 | $436,840 | $122,290 |
Source: Public Records
Map
Nearby Homes
- 1222 Temple City Blvd
- 1228 Temple City Blvd
- 6641 Barela Ave
- 1140 Arcadia Ave
- 1122 Arcadia Ave Unit D
- 1156 Arcadia Ave Unit 5
- 1231 S Golden West Ave Unit 3
- 1088 Sunset Blvd Unit A
- 1058 Sunset Blvd Unit B
- 1037 Sunset Blvd Unit B
- 9654 Emperor Ave
- 905 W Duarte Rd Unit A
- 1126 Fairview Ave Unit 210
- 1126 Fairview Ave Unit 106
- 9192 Jaylee Dr
- 9144 E Fairview Ave
- 912 Arcadia Ave Unit 6
- 905 Sunset Blvd Unit A
- 946 Fairview Ave Unit 8
- 1124 W Huntington Dr Unit 2
- 9508 E Naomi Ave
- 9522 E Naomi Ave
- 9504 E Naomi Ave
- 9526 E Naomi Ave
- 9515 Ardendale Ave
- 9523 Ardendale Ave
- 9448 E Naomi Ave
- 9505 Ardendale Ave
- 9513 E Naomi Ave
- 9515 E Naomi Ave
- 9532 E Naomi Ave
- 9536 E Naomi Ave
- 9534 E Naomi Ave
- 9461 Ardendale Ave
- 9509 E Naomi Ave
- 9533 E Naomi Ave
- 9503 E Naomi Ave
- 9517 E Naomi Ave
- 9540 E Naomi Ave
- 9508 Ardendale Ave
Your Personal Tour Guide
Ask me questions while you tour the home.