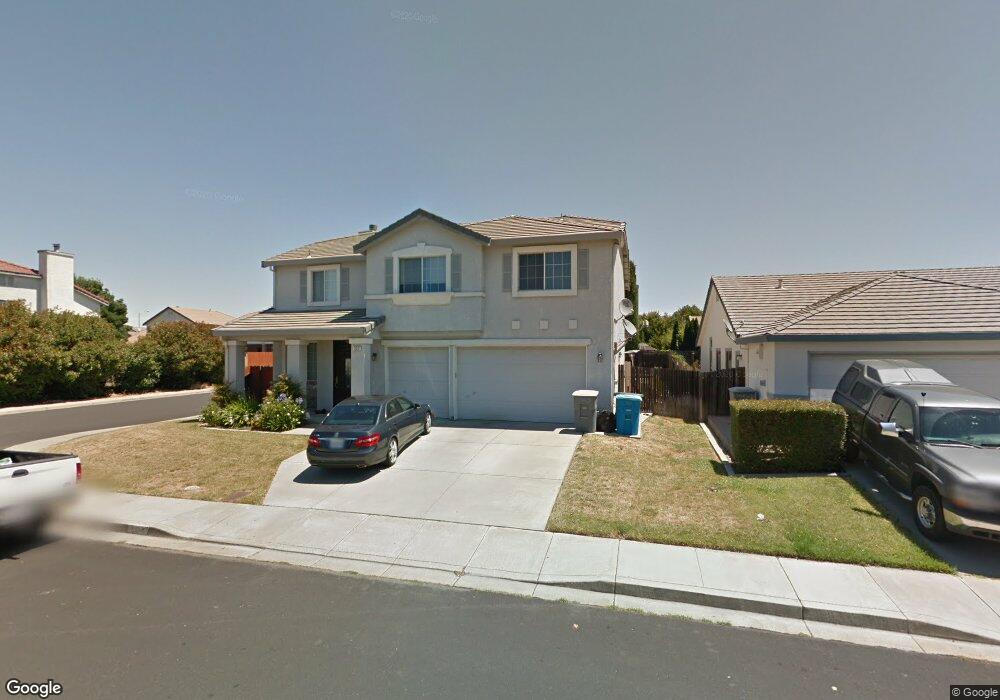
952 Ruby Dr Vacaville, CA 95687
Estimated Value: $705,000 - $768,000
4
Beds
3
Baths
3,050
Sq Ft
$242/Sq Ft
Est. Value
About This Home
This home is located at 952 Ruby Dr, Vacaville, CA 95687 and is currently estimated at $739,127, approximately $242 per square foot. 952 Ruby Dr is a home located in Solano County with nearby schools including Foxboro Elementary School, Golden West Middle School, and Vanden High School.
Ownership History
Date
Name
Owned For
Owner Type
Purchase Details
Closed on
Feb 24, 2015
Sold by
Ritter Larry W and Ritter Florita
Bought by
Ritter Larry W and Ritter Florita
Current Estimated Value
Home Financials for this Owner
Home Financials are based on the most recent Mortgage that was taken out on this home.
Original Mortgage
$300,000
Outstanding Balance
$229,939
Interest Rate
3.7%
Mortgage Type
New Conventional
Estimated Equity
$509,188
Purchase Details
Closed on
Apr 12, 2013
Sold by
Mercer James E
Bought by
Ritter Florita and Ritter Larry
Purchase Details
Closed on
Jul 23, 1997
Sold by
Lewis Homes Vacaville I
Bought by
Mercer James E and Ritter Larry Wayne
Home Financials for this Owner
Home Financials are based on the most recent Mortgage that was taken out on this home.
Original Mortgage
$203,000
Interest Rate
7.58%
Mortgage Type
VA
Create a Home Valuation Report for This Property
The Home Valuation Report is an in-depth analysis detailing your home's value as well as a comparison with similar homes in the area
Purchase History
| Date | Buyer | Sale Price | Title Company |
|---|---|---|---|
| Ritter Larry W | -- | None Available | |
| Ritter Florita | $100,000 | None Available | |
| Mercer James E | $212,000 | First American Title Guarant |
Source: Public Records
Mortgage History
| Date | Status | Borrower | Loan Amount |
|---|---|---|---|
| Open | Ritter Larry W | $300,000 | |
| Previous Owner | Mercer James E | $203,000 |
Source: Public Records
Tax History
| Year | Tax Paid | Tax Assessment Tax Assessment Total Assessment is a certain percentage of the fair market value that is determined by local assessors to be the total taxable value of land and additions on the property. | Land | Improvement |
|---|---|---|---|---|
| 2025 | $4,973 | $346,932 | $79,835 | $267,097 |
| 2024 | $4,973 | $340,130 | $78,270 | $261,860 |
| 2023 | $4,856 | $333,462 | $76,736 | $256,726 |
| 2022 | $4,752 | $326,925 | $75,232 | $251,693 |
| 2021 | $4,737 | $320,515 | $73,757 | $246,758 |
| 2020 | $4,698 | $317,229 | $73,001 | $244,228 |
| 2019 | $4,612 | $311,010 | $71,570 | $239,440 |
| 2018 | $4,549 | $304,913 | $70,167 | $234,746 |
| 2017 | $4,420 | $298,936 | $68,792 | $230,144 |
| 2016 | $4,365 | $293,076 | $67,444 | $225,632 |
| 2015 | $4,318 | $288,674 | $66,431 | $222,243 |
| 2014 | -- | $283,020 | $65,130 | $217,890 |
Source: Public Records
Map
Nearby Homes
- 967 Copper Way
- 897 Sapphire Cir
- 954 Iron Dr
- 805 Broadfork Cir
- 3007 Norwich Ct
- 1007 Canterbury Ct
- 196 Somerville Dr
- 116 Heritage Ln
- 448 Potters Ln
- 531 Colonial Cir
- 339 Aaron Cir
- 250 Somerville Dr
- 556 Somerville Cir
- 821 Saddle Horn Trail
- 766 Calico Trail
- 631 Colemanite Cir
- 196 Caldwell Dr
- 7079 Westminster Ct
- 165 Audrey Place
- 154 Brockton Ct
Your Personal Tour Guide
Ask me questions while you tour the home.