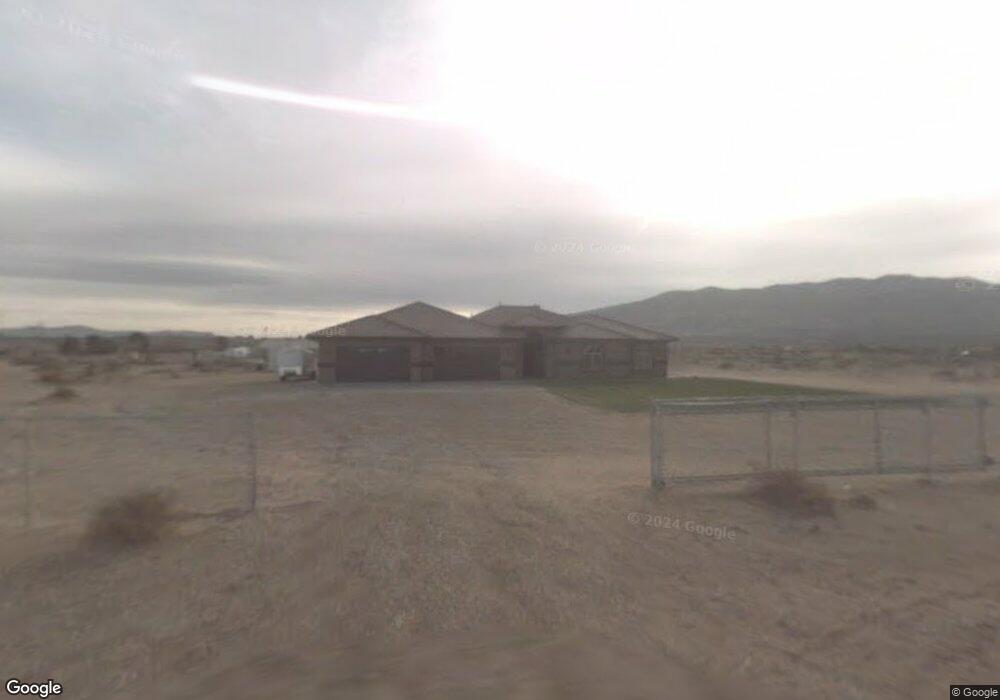
9525 Locust Ln Apple Valley, CA 92308
High Desert NeighborhoodEstimated Value: $628,000 - $836,000
4
Beds
4
Baths
3,490
Sq Ft
$200/Sq Ft
Est. Value
About This Home
This home is located at 9525 Locust Ln, Apple Valley, CA 92308 and is currently estimated at $696,261, approximately $199 per square foot. 9525 Locust Ln is a home located in San Bernardino County with nearby schools including Mariana Academy and Apple Valley High School.
Ownership History
Date
Name
Owned For
Owner Type
Purchase Details
Closed on
Oct 11, 2011
Sold by
Peratt James B and Peratt Gretchen
Bought by
Olmos Maxemiliano
Current Estimated Value
Home Financials for this Owner
Home Financials are based on the most recent Mortgage that was taken out on this home.
Original Mortgage
$214,423
Interest Rate
4.4%
Mortgage Type
FHA
Purchase Details
Closed on
Oct 4, 2011
Sold by
Lash Yvette Marie
Bought by
Olmos Maxemiliano
Home Financials for this Owner
Home Financials are based on the most recent Mortgage that was taken out on this home.
Original Mortgage
$214,423
Interest Rate
4.4%
Mortgage Type
FHA
Purchase Details
Closed on
Sep 1, 2005
Sold by
Webster Cheryl Elaine and Smith Cheryl Elaine
Bought by
Peratt James B and Peratt Gretchen
Purchase Details
Closed on
Jan 4, 1994
Sold by
Smith Ophelia D
Bought by
Smith Michael Conrad and Smith Cheryl Elaine
Create a Home Valuation Report for This Property
The Home Valuation Report is an in-depth analysis detailing your home's value as well as a comparison with similar homes in the area
Home Values in the Area
Average Home Value in this Area
Purchase History
| Date | Buyer | Sale Price | Title Company |
|---|---|---|---|
| Olmos Maxemiliano | $230,000 | Lawyers Title Company | |
| Olmos Maxemiliano | -- | Lawyers Title Company | |
| Peratt James B | $95,000 | Fidelity National Title Co | |
| Smith Michael Conrad | -- | United Title Company |
Source: Public Records
Mortgage History
| Date | Status | Borrower | Loan Amount |
|---|---|---|---|
| Previous Owner | Olmos Maxemiliano | $214,423 |
Source: Public Records
Tax History Compared to Growth
Tax History
| Year | Tax Paid | Tax Assessment Tax Assessment Total Assessment is a certain percentage of the fair market value that is determined by local assessors to be the total taxable value of land and additions on the property. | Land | Improvement |
|---|---|---|---|---|
| 2025 | $3,407 | $288,771 | $72,194 | $216,577 |
| 2024 | $3,407 | $283,108 | $70,778 | $212,330 |
| 2023 | $3,377 | $277,557 | $69,390 | $208,167 |
| 2022 | $3,327 | $272,114 | $68,029 | $204,085 |
| 2021 | $3,253 | $266,778 | $66,695 | $200,083 |
| 2020 | $3,215 | $264,042 | $66,011 | $198,031 |
| 2019 | $3,158 | $258,865 | $64,717 | $194,148 |
| 2018 | $3,082 | $253,789 | $63,448 | $190,341 |
| 2017 | $3,042 | $248,813 | $62,204 | $186,609 |
| 2016 | $2,933 | $243,934 | $60,984 | $182,950 |
| 2015 | $2,891 | $240,270 | $60,068 | $180,202 |
| 2014 | $2,854 | $235,563 | $58,891 | $176,672 |
Source: Public Records
Map
Nearby Homes
- 19453 Maple Creek Rd
- 10041 Wilmington Ln
- 10065 Wilmington Ln
- 10030 El Dorado St
- 9546 Verdugo Ave
- 0 Deep Creek Unit HD25229458
- 0 Deep Creek Rd Unit HD24140323
- 10215 Wascana Ln
- 9022 Glendale Ave
- 19158 Live Oak St
- 10301 Darby Rd
- 9503 San Pablo Ave
- 0 Glendale Ave Unit HD25103572
- 0 Glendale Ave Unit HD25103550
- 8944 Glendale Ave
- 19478 Big Horn St
- 18994 Vine St
- 9820 Deep Creek Rd
- 19101 Live Oak St
- 10364 Lakeshore Dr
- 9571 Locust Ln
- 9520 Tesuque Rd
- 9580 Tesuque Rd
- 9625 Locust Ln
- 9575 Tesuque Rd
- 9474 Tesuque Rd
- 9646 Tesuque Rd
- 9626 Locust Ln
- 9451 Tesuque Rd
- 19895 Rancho St
- 19835 Ocotillo Way
- 19979 Benica Rd
- 19869 Ocotillo Way
- 19951 Ocotillo Way
- 9534 Deep Creek Rd
- 9312 Deep Creek Rd
- 20080 Rancho St
- 20021 Ocotillo Way
- 9714 Zepher Ct
- 9618 Deep Creek Rd