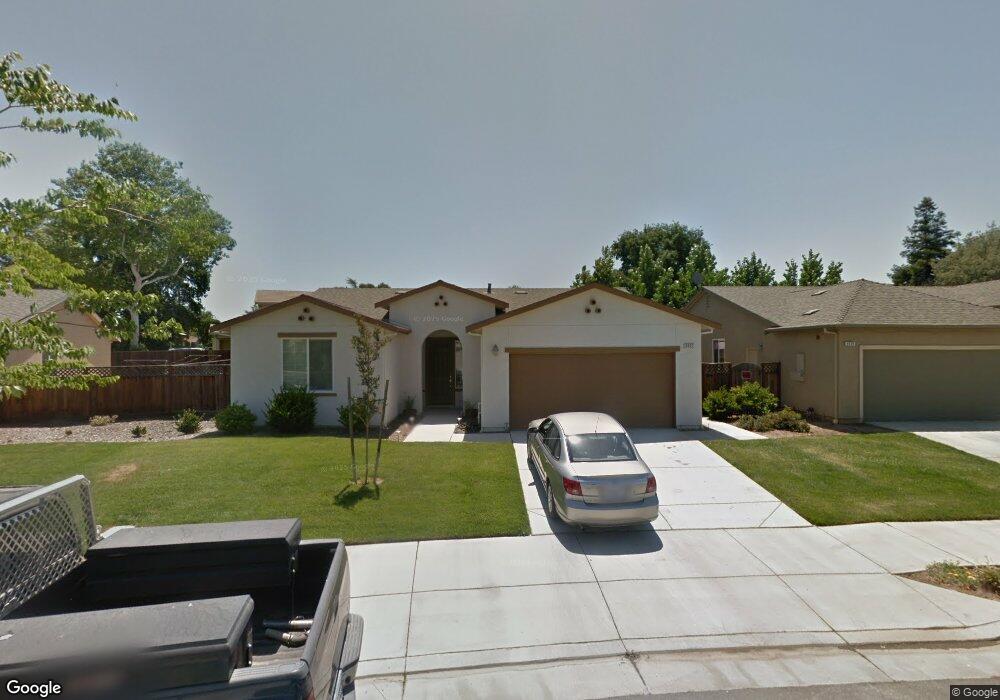
9527 Reed St Knights Landing, CA 95645
Estimated Value: $218,000 - $560,000
4
Beds
2
Baths
1,625
Sq Ft
$261/Sq Ft
Est. Value
About This Home
This home is located at 9527 Reed St, Knights Landing, CA 95645 and is currently estimated at $423,383, approximately $260 per square foot. 9527 Reed St is a home located in Yolo County with nearby schools including Lee Middle School, Woodland Senior High School, and Science & Technology Academy At Knights Landing.
Ownership History
Date
Name
Owned For
Owner Type
Purchase Details
Closed on
Apr 6, 2011
Sold by
Kla Properties Llc
Bought by
Stabler James and Stabler Michelle
Current Estimated Value
Home Financials for this Owner
Home Financials are based on the most recent Mortgage that was taken out on this home.
Original Mortgage
$174,800
Interest Rate
4.72%
Mortgage Type
New Conventional
Purchase Details
Closed on
Mar 17, 2010
Sold by
Dclj Partners Llc
Bought by
Kla Properties Llc
Purchase Details
Closed on
Dec 17, 2008
Sold by
Castle Principles Llc
Bought by
Dclj Partners Llc
Home Financials for this Owner
Home Financials are based on the most recent Mortgage that was taken out on this home.
Original Mortgage
$400,000
Interest Rate
6.1%
Mortgage Type
Seller Take Back
Create a Home Valuation Report for This Property
The Home Valuation Report is an in-depth analysis detailing your home's value as well as a comparison with similar homes in the area
Home Values in the Area
Average Home Value in this Area
Purchase History
| Date | Buyer | Sale Price | Title Company |
|---|---|---|---|
| Stabler James | $184,000 | First American Title Company | |
| Kla Properties Llc | -- | First American Title Company | |
| Dclj Partners Llc | -- | First American Title Company |
Source: Public Records
Mortgage History
| Date | Status | Borrower | Loan Amount |
|---|---|---|---|
| Previous Owner | Stabler James | $174,800 | |
| Previous Owner | Dclj Partners Llc | $400,000 |
Source: Public Records
Tax History Compared to Growth
Tax History
| Year | Tax Paid | Tax Assessment Tax Assessment Total Assessment is a certain percentage of the fair market value that is determined by local assessors to be the total taxable value of land and additions on the property. | Land | Improvement |
|---|---|---|---|---|
| 2025 | $2,656 | $235,723 | $38,430 | $197,293 |
| 2023 | $2,656 | $226,572 | $36,939 | $189,633 |
| 2022 | $2,431 | $222,130 | $36,215 | $185,915 |
| 2021 | $2,393 | $217,775 | $35,505 | $182,270 |
| 2020 | $2,341 | $215,543 | $35,141 | $180,402 |
| 2019 | $2,319 | $211,317 | $34,452 | $176,865 |
| 2018 | $2,296 | $207,175 | $33,777 | $173,398 |
| 2017 | $2,248 | $203,114 | $33,115 | $169,999 |
| 2016 | $2,212 | $199,132 | $32,466 | $166,666 |
| 2015 | $1,883 | $196,142 | $31,979 | $164,163 |
| 2014 | $1,883 | $168,000 | $40,000 | $128,000 |
Source: Public Records
Map
Nearby Homes
- 9530 Oak Grove Ave
- 9659 Reed St
- 9675 Reed St
- 9683 Reed St
- 0 California 45
- 9888 S Oak Grove Ave
- 11010 County Road 116b
- 18598 California 113
- 4729 Santa Rosa Ave
- 39699 County Road 17a
- 0 W Catlett Rd Unit 18229377
- 0 County Road 18
- 14241 4th St
- 1462 Churchill Downs Ave
- 9232 County Road 95
- 10361 Garden Hwy
- 0 Garden Hwy Unit 225099415
- 0 Garden Hwy Unit 224106626
- 10113 Garden Hwy
- 250 Arlington Cir