Estimated Value: $356,166 - $387,000
2
Beds
2
Baths
1,992
Sq Ft
$184/Sq Ft
Est. Value
About This Home
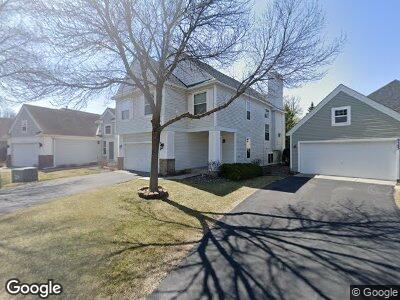
This home is located at 9529 Alvarado Ln N, Osseo, MN 55311 and is currently estimated at $365,542, approximately $183 per square foot. 9529 Alvarado Ln N is a home located in Hennepin County with nearby schools including Rush Creek Elementary School, Maple Grove Middle School, and Maple Grove Senior High School.
Ownership History
Date
Name
Owned For
Owner Type
Purchase Details
Closed on
Sep 18, 2020
Sold by
Stiele Dorothy J
Bought by
Aelgani Ranaveer
Current Estimated Value
Home Financials for this Owner
Home Financials are based on the most recent Mortgage that was taken out on this home.
Original Mortgage
$289,275
Outstanding Balance
$260,185
Interest Rate
2.9%
Mortgage Type
New Conventional
Estimated Equity
$105,357
Purchase Details
Closed on
Aug 4, 2005
Sold by
Hokanson Michael P and Duenwald Matthew R
Bought by
Stiele Dorothy J
Home Financials for this Owner
Home Financials are based on the most recent Mortgage that was taken out on this home.
Original Mortgage
$165,000
Interest Rate
5.69%
Mortgage Type
New Conventional
Purchase Details
Closed on
Mar 21, 2003
Sold by
Moline Jeffrey Scott
Bought by
Hokanson Michael P and Duenwald Matthew R
Purchase Details
Closed on
Jan 21, 1999
Sold by
The Rottlund Co
Bought by
Moline Jeffrey Scott
Create a Home Valuation Report for This Property
The Home Valuation Report is an in-depth analysis detailing your home's value as well as a comparison with similar homes in the area
Home Values in the Area
Average Home Value in this Area
Purchase History
| Date | Buyer | Sale Price | Title Company |
|---|---|---|---|
| Aelgani Ranaveer | $304,500 | Edina Realty Title Inc | |
| Stiele Dorothy J | $245,000 | -- | |
| Hokanson Michael P | $216,200 | -- | |
| Moline Jeffrey Scott | $159,076 | -- | |
| The Rottlund Company Inc | $9,750 | -- |
Source: Public Records
Mortgage History
| Date | Status | Borrower | Loan Amount |
|---|---|---|---|
| Open | Aelgani Ranaveer | $289,275 | |
| Previous Owner | Stiele Dorothy | $154,750 | |
| Previous Owner | Stiele Dorothy J | $56,000 | |
| Previous Owner | Stiele Dorothy J | $165,000 |
Source: Public Records
Tax History Compared to Growth
Tax History
| Year | Tax Paid | Tax Assessment Tax Assessment Total Assessment is a certain percentage of the fair market value that is determined by local assessors to be the total taxable value of land and additions on the property. | Land | Improvement |
|---|---|---|---|---|
| 2023 | $3,867 | $335,300 | $45,700 | $289,600 |
| 2022 | $3,353 | $344,600 | $52,600 | $292,000 |
| 2021 | $3,342 | $285,700 | $38,400 | $247,300 |
| 2020 | $3,270 | $280,500 | $40,600 | $239,900 |
| 2019 | $3,252 | $262,500 | $31,600 | $230,900 |
| 2018 | $2,979 | $248,100 | $27,100 | $221,000 |
| 2017 | $2,930 | $214,600 | $21,000 | $193,600 |
| 2016 | $2,928 | $211,900 | $29,000 | $182,900 |
| 2015 | $2,953 | $208,300 | $35,000 | $173,300 |
| 2014 | -- | $187,600 | $31,500 | $156,100 |
Source: Public Records
Map
Nearby Homes
- 9567 Alvarado Ln N
- 9694 Winslow Chase N
- 18869 97th Place N
- 18690 97th Place N
- 18602 97th Place N
- 9179 Larkspur Glade
- 19253 99th Place
- 18534 98th Place N
- 9885 Troy Ln N
- 18061 96th Ave N
- 18049 96th Ave N
- 19029 100th Place N
- 9001 Sawgrass Glen
- 19510 103rd Ave
- 19077 101st Place
- 19101 101st Place
- 9020 Tewsbury Gate
- 19086 100th Place N
- 8947 Vandegriff Way
- 9640 Peony Ln N Unit 1208
- 9529 Alvarado Ln N
- 9543 Alvarado Ln N
- 9515 Alvarado Ln N
- 9501 Alvarado Ln N
- 9549 Alvarado Ln N
- 9555 Alvarado Ln N
- 9528 Alvarado Ln N
- 9514 Alvarado Ln N
- 9542 Alvarado Ln N
- 9561 Alvarado Ln N
- 9556 Alvarado Ln N
- 19073 95th Ave N
- 19041 95th Ave N
- 19041 95th Ave N
- 19073 95th Ave N
- 18960 95th Ave N
- 9573 Alvarado Ln N
- 19029 95th Ave N
- 9570 Alvarado Ln N
- 18960 18960 95th-Avenue-n