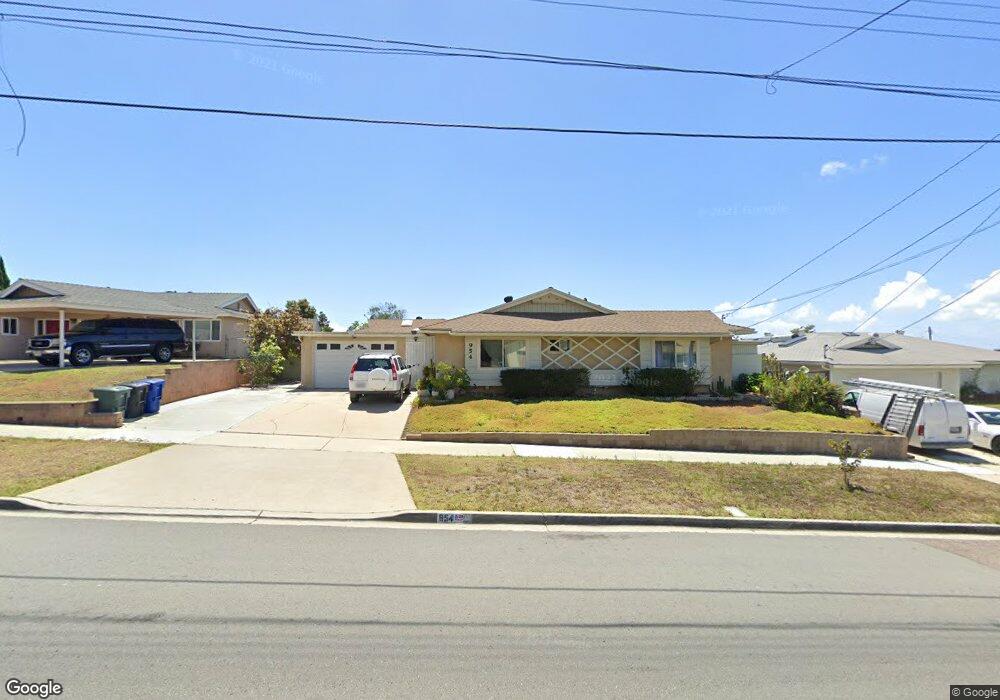
954 Melrose Ave Chula Vista, CA 91911
Castle Park NeighborhoodEstimated Value: $848,911 - $906,000
4
Beds
3
Baths
2,025
Sq Ft
$439/Sq Ft
Est. Value
About This Home
This home is located at 954 Melrose Ave, Chula Vista, CA 91911 and is currently estimated at $889,978, approximately $439 per square foot. 954 Melrose Ave is a home located in San Diego County with nearby schools including Karl H Kellogg Elementary School, Hilltop Middle School, and Hilltop Senior High School.
Ownership History
Date
Name
Owned For
Owner Type
Purchase Details
Closed on
Jun 28, 2006
Sold by
Larsen Magdalena M
Bought by
Larsen Karl F and Larsen Magdalena M
Current Estimated Value
Home Financials for this Owner
Home Financials are based on the most recent Mortgage that was taken out on this home.
Original Mortgage
$326,000
Outstanding Balance
$193,325
Interest Rate
6.63%
Mortgage Type
New Conventional
Estimated Equity
$696,654
Purchase Details
Closed on
Aug 29, 1995
Sold by
Larsen Karl F and Larsen Magdalena M
Bought by
Larsen Karl F and Larsen Magdalena M
Home Financials for this Owner
Home Financials are based on the most recent Mortgage that was taken out on this home.
Original Mortgage
$11,404
Interest Rate
7.83%
Purchase Details
Closed on
Jun 7, 1990
Create a Home Valuation Report for This Property
The Home Valuation Report is an in-depth analysis detailing your home's value as well as a comparison with similar homes in the area
Home Values in the Area
Average Home Value in this Area
Purchase History
| Date | Buyer | Sale Price | Title Company |
|---|---|---|---|
| Larsen Karl F | -- | Accommodation | |
| Larsen Magdalena M | -- | Old Republic Title Company | |
| Larsen Karl F | -- | United Title Company | |
| -- | $193,400 | -- |
Source: Public Records
Mortgage History
| Date | Status | Borrower | Loan Amount |
|---|---|---|---|
| Open | Larsen Magdalena M | $326,000 | |
| Closed | Larsen Karl F | $11,404 |
Source: Public Records
Tax History Compared to Growth
Tax History
| Year | Tax Paid | Tax Assessment Tax Assessment Total Assessment is a certain percentage of the fair market value that is determined by local assessors to be the total taxable value of land and additions on the property. | Land | Improvement |
|---|---|---|---|---|
| 2025 | $2,127 | $355,778 | $167,423 | $188,355 |
| 2024 | $2,127 | $348,803 | $164,141 | $184,662 |
| 2023 | $2,160 | $341,965 | $160,923 | $181,042 |
| 2022 | $3,857 | $335,261 | $157,768 | $177,493 |
| 2021 | $3,767 | $328,688 | $154,675 | $174,013 |
| 2020 | $3,676 | $325,318 | $153,089 | $172,229 |
| 2019 | $3,580 | $318,940 | $150,088 | $168,852 |
| 2018 | $3,523 | $312,688 | $147,146 | $165,542 |
| 2017 | $10 | $306,558 | $144,261 | $162,297 |
| 2016 | $3,366 | $300,548 | $141,433 | $159,115 |
| 2015 | $3,317 | $296,034 | $139,309 | $156,725 |
| 2014 | $3,261 | $290,236 | $136,581 | $153,655 |
Source: Public Records
Map
Nearby Homes
- 158 E L St
- 859 Tamayo Dr Unit 2
- 859 Tamayo Dr Unit 1
- 835 Tamayo Dr Unit 6
- 953 Barrett Ave
- 814 Tamayo Dr Unit 2
- 62 E Palomar Dr
- 52 E L St
- 1184 Monterey Place
- 202 E J St
- 826 Floyd Ave
- 838 David Dr
- 620 Telegraph Canyon Rd Unit C
- 1267 Melrose Ave
- 152 E Orlando St
- 647 Claire Ave
- 1241 Raven Ave
- 514 Avenida Centro Unit 105
- 514 Avenida Centro Unit 114
- 586 88 Roosevelt St
- 960 Melrose Ave
- 950 Melrose Ave
- 953 Maria Way
- 955 Maria Way
- 949 Maria Way
- 959 Maria Way
- 966 Melrose Ave
- 944 Melrose Ave
- 961 Melrose Ave
- 959 Melrose Ave
- 943 Maria Way
- 971 Maria Way
- 965 Melrose Ave
- 953 Melrose Ave
- 972 Melrose Ave
- 938 Melrose Ave
- 949 Melrose Ave
- 937 Maria Way
- 977 Maria Way
- 954 Maria Way