954 Tate Cir Billings, MT 59105
Billings Heights NeighborhoodEstimated Value: $355,000 - $427,000
4
Beds
3
Baths
2,512
Sq Ft
$158/Sq Ft
Est. Value
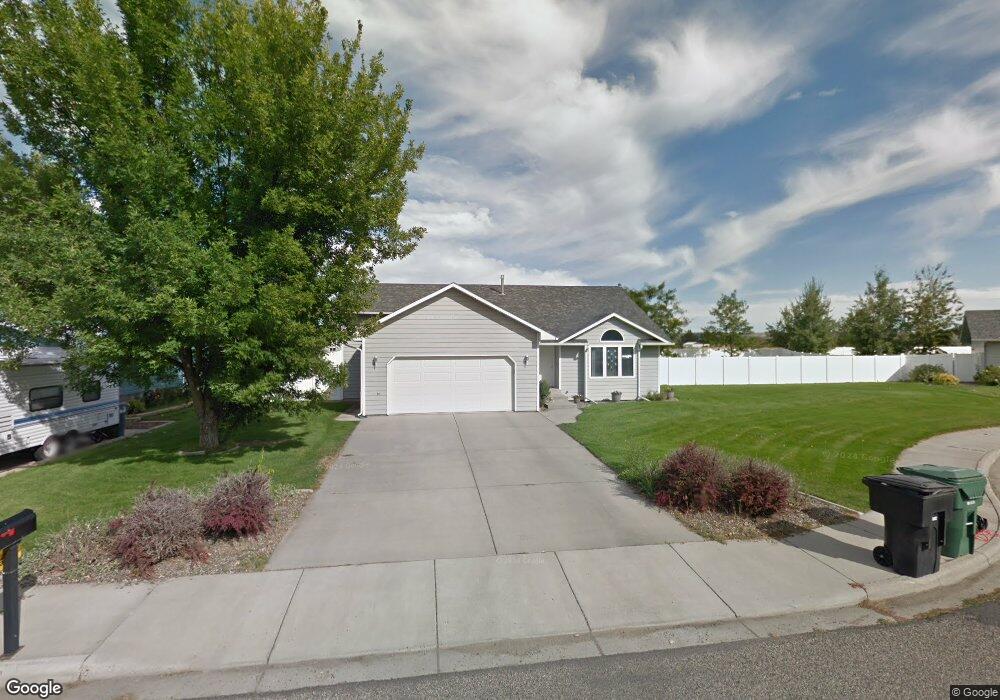
About This Home
This home is located at 954 Tate Cir, Billings, MT 59105 and is currently estimated at $397,503, approximately $158 per square foot. 954 Tate Cir is a home located in Yellowstone County with nearby schools including Bitterroot School, Medicine Crow Middle School, and Skyview High School.
Ownership History
Date
Name
Owned For
Owner Type
Purchase Details
Closed on
Apr 14, 2021
Sold by
Longfellow Casey B
Bought by
Longfellow Casey B and Longfellow Jamie L
Current Estimated Value
Purchase Details
Closed on
May 25, 2011
Sold by
Harper Robert D and Harper Shalene Marie
Bought by
Longfellow Casey
Home Financials for this Owner
Home Financials are based on the most recent Mortgage that was taken out on this home.
Original Mortgage
$226,995
Outstanding Balance
$153,093
Interest Rate
4.25%
Mortgage Type
FHA
Estimated Equity
$244,410
Create a Home Valuation Report for This Property
The Home Valuation Report is an in-depth analysis detailing your home's value as well as a comparison with similar homes in the area
Home Values in the Area
Average Home Value in this Area
Purchase History
| Date | Buyer | Sale Price | Title Company |
|---|---|---|---|
| Longfellow Casey B | -- | Accurate Group Llc | |
| Longfellow Casey | -- | None Available |
Source: Public Records
Mortgage History
| Date | Status | Borrower | Loan Amount |
|---|---|---|---|
| Open | Longfellow Casey | $226,995 |
Source: Public Records
Tax History Compared to Growth
Tax History
| Year | Tax Paid | Tax Assessment Tax Assessment Total Assessment is a certain percentage of the fair market value that is determined by local assessors to be the total taxable value of land and additions on the property. | Land | Improvement |
|---|---|---|---|---|
| 2025 | $3,715 | $397,800 | $77,256 | $320,544 |
| 2024 | $3,715 | $360,100 | $70,330 | $289,770 |
| 2023 | $3,761 | $360,100 | $70,330 | $289,770 |
| 2022 | $3,341 | $278,700 | $0 | $0 |
| 2021 | $3,131 | $278,700 | $0 | $0 |
| 2020 | $2,993 | $252,400 | $0 | $0 |
| 2019 | $2,860 | $252,400 | $0 | $0 |
| 2018 | $2,713 | $234,500 | $0 | $0 |
| 2017 | $2,636 | $234,500 | $0 | $0 |
| 2016 | $2,473 | $222,900 | $0 | $0 |
| 2015 | $2,426 | $222,900 | $0 | $0 |
| 2014 | $2,227 | $107,961 | $0 | $0 |
Source: Public Records
Map
Nearby Homes