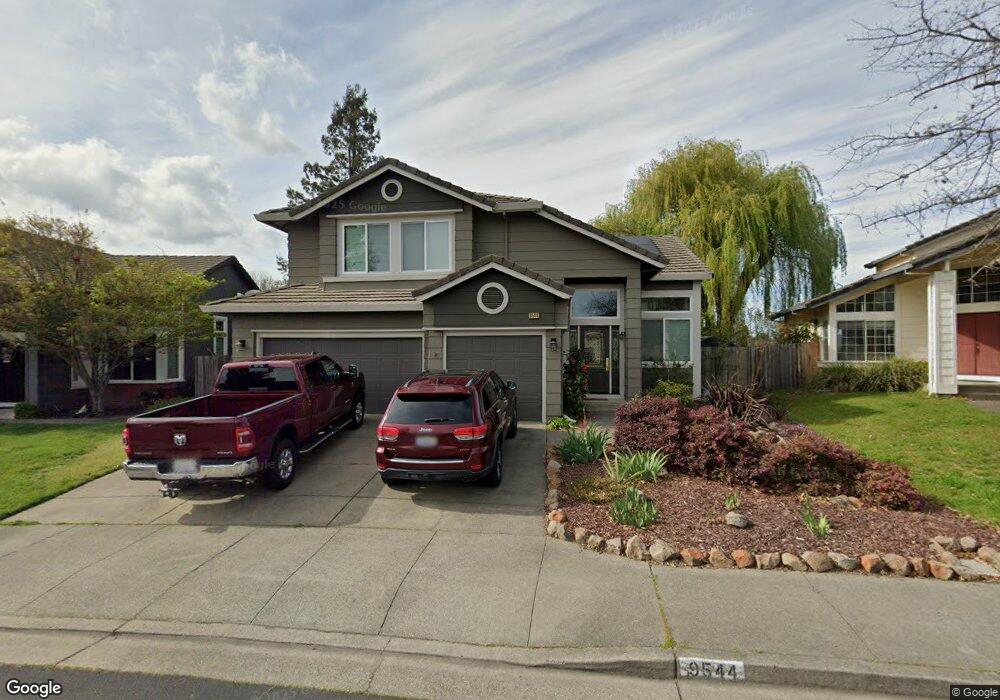
9544 Wellington Cir Windsor, CA 95492
Estimated Value: $905,000 - $1,069,000
4
Beds
3
Baths
2,364
Sq Ft
$404/Sq Ft
Est. Value
About This Home
This home is located at 9544 Wellington Cir, Windsor, CA 95492 and is currently estimated at $954,863, approximately $403 per square foot. 9544 Wellington Cir is a home located in Sonoma County with nearby schools including Mattie Washburn Elementary School, Brooks Elementary School, and Windsor Middle School.
Ownership History
Date
Name
Owned For
Owner Type
Purchase Details
Closed on
May 6, 2016
Sold by
Aurelius Mark and Estate Of Gordon Dennis Gary
Bought by
Tremayne Jarrod R and Tremayne Bradley C
Current Estimated Value
Home Financials for this Owner
Home Financials are based on the most recent Mortgage that was taken out on this home.
Original Mortgage
$496,000
Outstanding Balance
$395,492
Interest Rate
3.71%
Mortgage Type
New Conventional
Estimated Equity
$559,371
Purchase Details
Closed on
Mar 4, 2011
Sold by
Gary Gordon Dennis
Bought by
Gary Gordon Dennis
Home Financials for this Owner
Home Financials are based on the most recent Mortgage that was taken out on this home.
Original Mortgage
$592,500
Interest Rate
2.51%
Mortgage Type
Reverse Mortgage Home Equity Conversion Mortgage
Purchase Details
Closed on
Feb 24, 1996
Sold by
Gary Gordon H and Gary Mercedes N
Bought by
Gary Gordon Dennis
Create a Home Valuation Report for This Property
The Home Valuation Report is an in-depth analysis detailing your home's value as well as a comparison with similar homes in the area
Home Values in the Area
Average Home Value in this Area
Purchase History
| Date | Buyer | Sale Price | Title Company |
|---|---|---|---|
| Tremayne Jarrod R | $620,000 | Fidelity National Title Co | |
| Gary Gordon Dennis | -- | None Available | |
| Gary Gordon Dennis | -- | -- |
Source: Public Records
Mortgage History
| Date | Status | Borrower | Loan Amount |
|---|---|---|---|
| Open | Tremayne Jarrod R | $496,000 | |
| Previous Owner | Gary Gordon Dennis | $592,500 |
Source: Public Records
Tax History Compared to Growth
Tax History
| Year | Tax Paid | Tax Assessment Tax Assessment Total Assessment is a certain percentage of the fair market value that is determined by local assessors to be the total taxable value of land and additions on the property. | Land | Improvement |
|---|---|---|---|---|
| 2025 | $8,648 | $733,946 | $293,578 | $440,368 |
| 2024 | $8,648 | $719,556 | $287,822 | $431,734 |
| 2023 | $8,648 | $705,448 | $282,179 | $423,269 |
| 2022 | $8,335 | $691,617 | $276,647 | $414,970 |
| 2021 | $8,202 | $678,057 | $271,223 | $406,834 |
| 2020 | $8,388 | $671,105 | $268,442 | $402,663 |
| 2019 | $8,379 | $657,947 | $263,179 | $394,768 |
| 2018 | $8,258 | $645,047 | $258,019 | $387,028 |
| 2017 | $8,179 | $632,400 | $252,960 | $379,440 |
| 2016 | $7,459 | $351,029 | $134,435 | $216,594 |
| 2015 | $4,340 | $345,757 | $132,416 | $213,341 |
| 2014 | $4,275 | $338,985 | $129,823 | $209,162 |
Source: Public Records
Map
Nearby Homes
- 9512 Wellington Cir
- 9616 Berkshire Way
- 1025 Hampshire Ln
- 9896 Sunray Place
- 845 Starr Cir
- 9784 Dawn Way
- 563 Windsor River Rd
- 411 Walten Way
- 538 Emily Rose Cir
- 848 Mcclelland Dr Unit U4
- 8668 Starr Rd
- 129 Wooded Glen Ct
- 412 Jane Dr
- 9551 Old Redwood Hwy
- 8185 Old Redwood Hwy
- 202 Johnson St Unit U14
- 234 Johnson St
- 185 Johnson St
- 651 Decanter Cir
- 9376 Jessica Dr
- 9548 Wellington Cir
- 9540 Wellington Cir
- 9536 Wellington Cir
- 9552 Wellington Cir
- 9539 Wellington Cir
- 9543 Wellington Cir
- 9532 Wellington Cir
- 9547 Wellington Cir
- 9533 Wellington Cir
- 1112 Graham Ct
- 9560 Wellington Cir
- 9528 Wellington Cir
- 1116 Graham Ct
- 9421 Kensington Ct
- 9551 Wellington Cir
- 9417 Kensington Ct
- 9525 Wellington Cir
- 9564 Wellington Cir
- 1117 Graham Ct