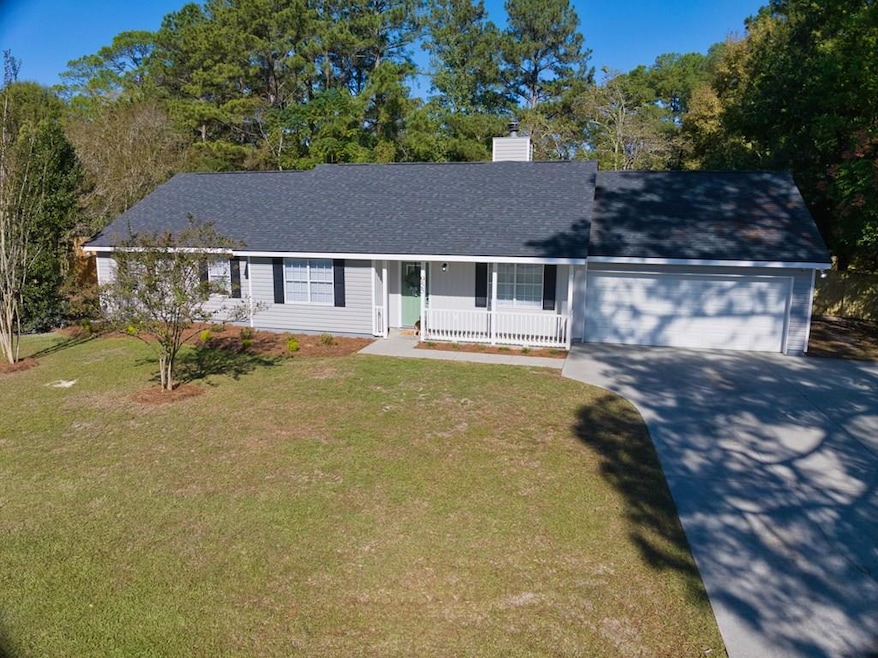
955 E Main St Hahira, GA 31632
Estimated payment $1,551/month
Highlights
- No HOA
- Tile Flooring
- 2 Car Garage
- Hahira Elementary School Rated A
- Central Heating and Cooling System
- Fenced
About This Home
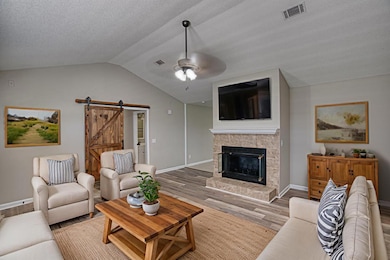
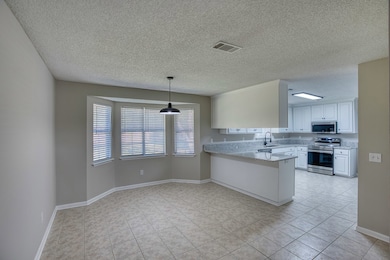
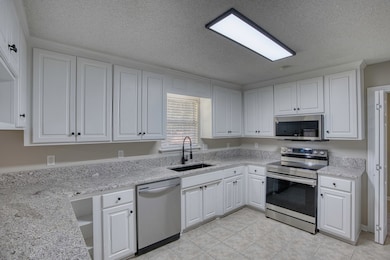
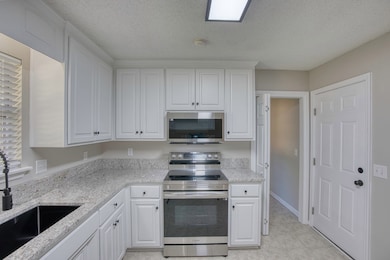
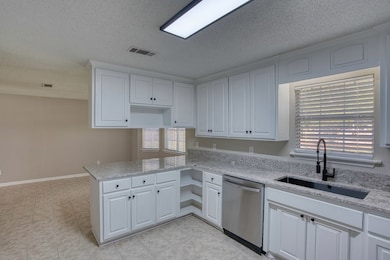
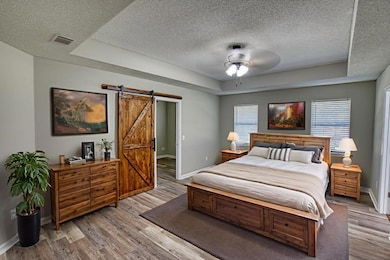
This beautifully updated 4-bedroom, 2.5-bath home offers the perfect blend of modern updates and small-town charm. Inside, you'll find fresh interior paint throughout, a bright and inviting living area and an additional flex room that's perfect for a home office, nursery, or hobby space. The kitchen features brand new stainless steel appliances and granite countertops that continue throughout the home. Each bedroom offers ample space and comfort, while the primary suite provides a peaceful retreat with its own private bath. Step outside to enjoy the large fenced-in backyard—ideal for pets, play, and entertaining. Conveniently located near downtown Hahira, schools, and parks, this move-in-ready home is one you don't want to miss! Zoned for Lowndes County Schools.
Listing Agent
The American Dream Brokerage Phone: 8004511603 License #422784 Listed on: 10/20/2025
Home Details
Home Type
- Single Family
Year Built
- Built in 1997
Lot Details
- 0.47 Acre Lot
- Lot Dimensions are 165 x 170 x 105 x 160
- Fenced
- Property is zoned R-15
Parking
- 2 Car Garage
- Driveway
Home Design
- Vinyl Siding
Interior Spaces
- 1,986 Sq Ft Home
- 1-Story Property
Kitchen
- Electric Range
- Microwave
- Dishwasher
Flooring
- Tile
- Luxury Vinyl Tile
Bedrooms and Bathrooms
- 4 Bedrooms
Utilities
- Central Heating and Cooling System
Community Details
- No Home Owners Association
Listing and Financial Details
- Assessor Parcel Number 0047 004
Map
Home Values in the Area
Average Home Value in this Area
Tax History
| Year | Tax Paid | Tax Assessment Tax Assessment Total Assessment is a certain percentage of the fair market value that is determined by local assessors to be the total taxable value of land and additions on the property. | Land | Improvement |
|---|---|---|---|---|
| 2024 | -- | $84,030 | $9,180 | $74,850 |
| 2023 | $0 | $84,030 | $9,180 | $74,850 |
| 2022 | $2,005 | $64,410 | $9,180 | $55,230 |
| 2021 | $2,042 | $64,410 | $9,180 | $55,230 |
| 2020 | $1,726 | $54,277 | $9,180 | $45,097 |
| 2019 | $1,741 | $54,277 | $9,180 | $45,097 |
| 2018 | $1,756 | $54,277 | $9,180 | $45,097 |
| 2017 | $1,781 | $54,277 | $9,180 | $45,097 |
| 2016 | $1,785 | $54,277 | $9,180 | $45,097 |
| 2015 | -- | $54,277 | $9,180 | $45,097 |
| 2014 | $1,751 | $54,277 | $9,180 | $45,097 |
Property History
| Date | Event | Price | List to Sale | Price per Sq Ft |
|---|---|---|---|---|
| 10/20/2025 10/20/25 | For Sale | $295,000 | -- | $149 / Sq Ft |
Purchase History
| Date | Type | Sale Price | Title Company |
|---|---|---|---|
| Limited Warranty Deed | $180,000 | -- | |
| Warranty Deed | $162,500 | -- | |
| Deed | $170,000 | -- | |
| Deed | $135,000 | -- | |
| Deed | $11,000 | -- | |
| Deed | -- | -- |
Mortgage History
| Date | Status | Loan Amount | Loan Type |
|---|---|---|---|
| Previous Owner | $162,500 | VA | |
| Previous Owner | $175,600 | VA |
Source: South Georgia MLS
MLS Number: 146569
APN: 0047-004
- 900 E Main St
- 601 E Stanfill St
- 604 E Lawson St
- 601 Katherine Ln
- 0 E Stanfill St
- 627 Stagecoach Trail
- 1105 Hannah Dr
- 1101 Hannah Dr
- 1063 Angie Ln
- 351 Barry Field Cir
- 228 Barry Field Cir
- 500 S Nelson St
- The Walker Plan at Reynolda Place
- The Belfort Plan at Reynolda Place
- The Ozark Plan at Reynolda Place
- The Beau Plan at Reynolda Place
- 1055 Angie Ln
- 374 Barry Field Cir
- 167 Floyd McNeal Dr
- 211 Bluebird Cove
- 7400 Georgia 122
- 5171 Abbott Cir
- 4534 N Valdosta Rd
- 3304 S Hutchinson Ave
- 4750 Mac Rd
- 5269 Dr
- 3715 N Valdosta Rd
- 4066 Mckenzie Ln
- 3833 N Oak Street Extension
- 3925 N Oak Street Extension
- 3944 Medieval Ct
- 5201b Greyfield Cir
- 4901 Stonebrooke Dr Unit LISMORE
- 5148 Northwind Blvd
- 3531 Club Villas Dr
- 3131 N Oak Street Extension
- 480 Murray Rd
- 168 Azalea St
- 100 Garden Dr
- 420 Connell Rd
