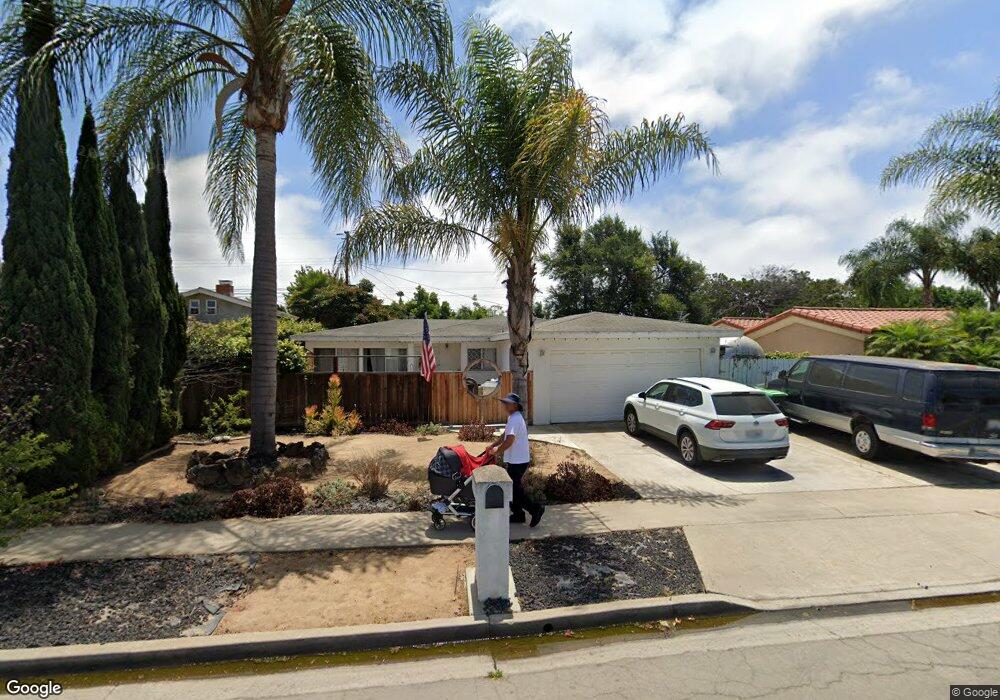
955 Joann St Costa Mesa, CA 92627
Westside Costa Mesa NeighborhoodEstimated Value: $1,214,000 - $1,265,000
3
Beds
2
Baths
1,017
Sq Ft
$1,222/Sq Ft
Est. Value
About This Home
This home is located at 955 Joann St, Costa Mesa, CA 92627 and is currently estimated at $1,243,265, approximately $1,222 per square foot. 955 Joann St is a home located in Orange County with nearby schools including Victoria Elementary School, Charles W. Tewinkle Middle School, and Estancia High School.
Ownership History
Date
Name
Owned For
Owner Type
Purchase Details
Closed on
May 21, 2015
Sold by
Morgan Nial R
Bought by
Morgan Nial R and Morgan Trust
Current Estimated Value
Purchase Details
Closed on
Aug 12, 2004
Sold by
Sandoval Edelmira
Bought by
Sandoval Jose
Purchase Details
Closed on
Jul 15, 2004
Sold by
Sandoval Jose
Bought by
Morgan Nial R and Morgan Yvonne
Purchase Details
Closed on
May 16, 2001
Sold by
Sandoval Jose and Sandoval Josefina
Bought by
Sandoval Jose
Home Financials for this Owner
Home Financials are based on the most recent Mortgage that was taken out on this home.
Original Mortgage
$183,219
Interest Rate
7.03%
Purchase Details
Closed on
Jun 7, 1995
Sold by
Kistler Michael C and Kistler Sandra F
Bought by
Sandoval Jose and Sandoval Josefina
Home Financials for this Owner
Home Financials are based on the most recent Mortgage that was taken out on this home.
Original Mortgage
$172,550
Interest Rate
7.59%
Create a Home Valuation Report for This Property
The Home Valuation Report is an in-depth analysis detailing your home's value as well as a comparison with similar homes in the area
Home Values in the Area
Average Home Value in this Area
Purchase History
| Date | Buyer | Sale Price | Title Company |
|---|---|---|---|
| Morgan Nial R | -- | None Available | |
| Morgan Nial | -- | None Available | |
| Sandoval Jose | -- | -- | |
| Morgan Nial R | -- | United Title Company | |
| Sandoval Jose | -- | -- | |
| Sandoval Jose | $178,000 | -- |
Source: Public Records
Mortgage History
| Date | Status | Borrower | Loan Amount |
|---|---|---|---|
| Previous Owner | Sandoval Jose | $183,219 | |
| Previous Owner | Sandoval Jose | $172,550 |
Source: Public Records
Tax History Compared to Growth
Tax History
| Year | Tax Paid | Tax Assessment Tax Assessment Total Assessment is a certain percentage of the fair market value that is determined by local assessors to be the total taxable value of land and additions on the property. | Land | Improvement |
|---|---|---|---|---|
| 2025 | $8,978 | $772,221 | $712,639 | $59,582 |
| 2024 | $8,978 | $757,080 | $698,666 | $58,414 |
| 2023 | $8,700 | $742,236 | $684,967 | $57,269 |
| 2022 | $8,446 | $727,683 | $671,536 | $56,147 |
| 2021 | $8,220 | $713,415 | $658,368 | $55,047 |
| 2020 | $8,127 | $706,100 | $651,617 | $54,483 |
| 2019 | $7,955 | $692,255 | $638,840 | $53,415 |
| 2018 | $7,796 | $678,682 | $626,314 | $52,368 |
| 2017 | $7,419 | $642,000 | $597,521 | $44,479 |
| 2016 | $7,025 | $607,000 | $562,521 | $44,479 |
| 2015 | $6,350 | $540,318 | $495,839 | $44,479 |
| 2014 | -- | $540,318 | $495,839 | $44,479 |
Source: Public Records
Map
Nearby Homes
- 2245 State Ave
- 2230 Canyon Dr
- 939 Congress St
- 2252 Federal Ave
- 2064 Republic Ave
- 2023 Republic Ave
- 1269 Westreef
- 1289 Westreef St
- 919 Evergreen Place
- 21072 Galbar Cir
- 5 Sand Dollar Ct Unit 16
- 2187 Meyer Place
- 21022 Manessa Cir
- 1940 Whittier Ave
- 2074 Pomona Ave
- 1 Starfish Ct Unit 40
- 1953 Federal Ave
- 2208 Meyer Place
- 2028 Wallace Ave Unit C
- 2028 Wallace Ave