NOT LISTED FOR SALE

955 Wilmont Way Beaumont, CA 92223

Estimated Value: $465,000 - $496,000

3 Beds
2 Baths
1,400 Sq Ft
$345/Sq Ft Est. Value

Last Sold April 01, 2016

Last sale price $240,000 $171 Per Sq Ft

Est. 101% increase in value since last sale

Current estimated payment $2,905/month

About This Home

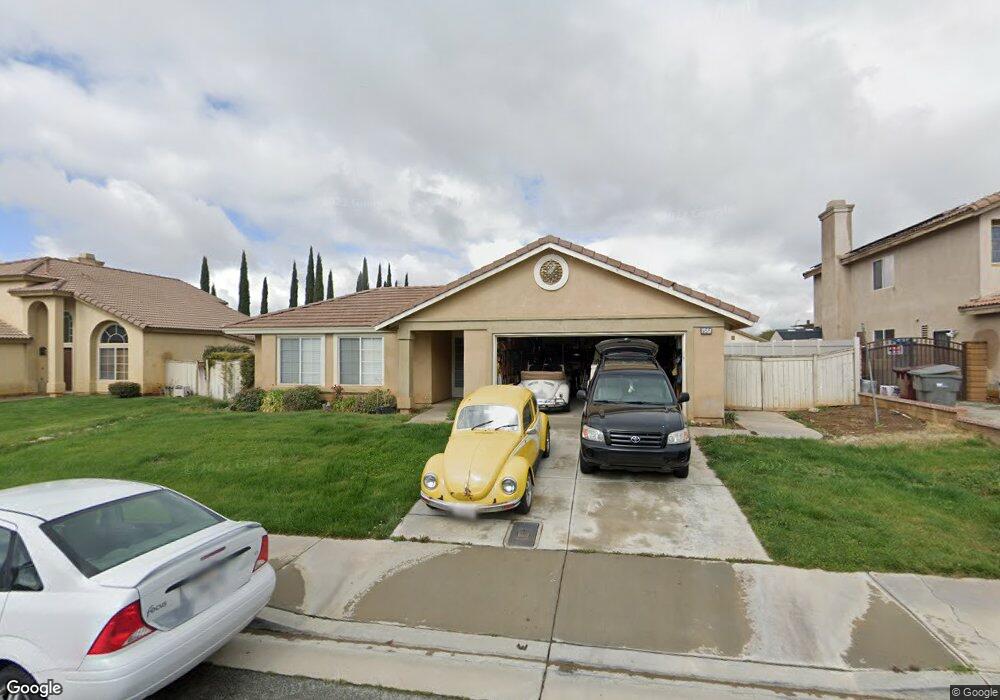
Opportunity to own a well kept home in a cul-de-sac. This property has a nice big lot and has been maintained very well. New paint, professionally cleaned carpet, landscaping... and much more. Attention to detail has definitely been exercised with this one. Conveniently located near the freeway and amenities makes this home a must see!

Ownership History

Date Name Owned For Owner Type

Purchase Details

Listed on
Jan 31, 2016
Closed on
Feb 22, 2016
Sold by
Flores Marcelino and Flores Maria E
Bought by
Casaclang Ma Henedina Almazan and Casaclang Antonio
Seller's Agent
Bryan Casella
eXp Realty of California Inc.
Buyer's Agent
Leah Larkin
MY LISTING SOURCE
List Price
$240,000
Sold Price
$240,000
Current Estimated Value
$482,420

Home Financials for this Owner

Home Financials are based on the most recent Mortgage that was taken out on this home.
Estimated Appreciation
$242,420
Avg. Annual Appreciation
7.56%
Original Mortgage
$235,653
Outstanding Balance
$186,629
Interest Rate
3.75%
Mortgage Type
FHA
Estimated Equity
$295,791

Purchase Details

Closed on
Dec 9, 2009
Sold by
Flores Marcelino and Flores Maria E
Bought by
Flores Marcelino and Flores Maria E

Purchase Details

Closed on
Mar 28, 2002
Sold by
Osborne Development Corp
Bought by
Flores Marcelino and Flores Maria E

Home Financials for this Owner

Home Financials are based on the most recent Mortgage that was taken out on this home.
Original Mortgage
$46,990
Interest Rate
6.78%
Source: Public Records

Range of Values:

Collateral Analytics

Collateral Analytics Collateral Analytics AVMs (Automated Valuation Model) employ a number of statistical approaches combined with neighborhood-specific comparable selection guarantees the most up-to-date and precise valuations.

Not Available

Collateral Analytics does not have data for the current month. Please view the chart for historical values.

ICE

ICE Mortgage Technology ICE Mortgage Technology’s AVM (Automated Valuation Model) is a state-of-the-art online residential property valuation tool that provides a quick and accurate estimate of the value of almost any home in the U.S.

Not Available

ICE Mortgage Technology does not have data for the current month. Please view the chart for historical values.

First American

First American First American Data & Analytics’ next-generation AVM combines unrivaled data assets with a blended ensemble of valuation models to produce highly accurate, reliable valuations you can trust.

Not Available

First American does not have data for the current month. Please view the chart for historical values.

Quantarium

Quantarium Quantarium’s valuation service, repeatedly proven the industry’s most accurate and comprehensive, is supercharged with a self-learning and auto-tuning AI engine that continually becomes smarter and more accurate as it processes daily inputs from the industry’s leading RE data lake.

Not Available

Quantarium does not have data for the current month. Please view the chart for historical values.

Average Value
Not Available
List Price
Sold Price
Create a Home Valuation Report for This Property
The Home Valuation Report is an in-depth analysis detailing your home's value as well as a comparison with similar homes in the area

Home Values in the Area

Source: Public Records

Average Home Value in this Area


Source: Public Records

Purchase History

Date Buyer Sale Price Title Company
Casaclang Ma Henedina Almazan $240,000 Fidelity National Title Co
Flores Marcelino -- None Available
Flores Marcelino $148,500 Fidelity National Title Co
Source: Public Records

Mortgage History

Date Status Borrower Loan Amount
Open Casaclang Ma Henedina Almazan $235,653
Previous Owner Flores Marcelino $46,990
Source: Public Records

Property History

Date Event Price List to Sale Price per Sq Ft Prior Sale
04/01/2016 04/01/16 Sold $240,000 0.0% $171 / Sq Ft View Prior Sale
02/05/2016 02/05/16 Pending -- -- --
01/31/2016 01/31/16 For Sale $240,000 0.0% $171 / Sq Ft
01/08/2016 01/08/16 Pending -- -- --
01/02/2016 01/02/16 For Sale $240,000 -- $171 / Sq Ft

Tax History Compared to Growth

Source: Public Records

Tax History

Year Tax Paid Tax Assessment Tax Assessment Total Assessment is a certain percentage of the fair market value that is determined by local assessors to be the total taxable value of land and additions on the property. Land Improvement
2025 $4,564 $284,105 $53,268 $230,837
2023 $4,564 $273,074 $51,200 $221,874
2022 $4,467 $267,721 $50,197 $217,524
2021 $4,398 $262,472 $49,213 $213,259
2020 $4,353 $259,782 $48,709 $211,073
2019 $4,276 $254,689 $47,754 $206,935
2018 $4,399 $249,696 $46,818 $202,878
2017 $4,461 $244,800 $45,900 $198,900
2016 $3,665 $184,804 $62,391 $122,413
2015 $3,604 $182,029 $61,454 $120,575
2014 $3,420 $161,000 $54,000 $107,000
Source: Public Records

Agents Affiliated with this Home

  • Section Image
  • Section Image
See All Agents

Map