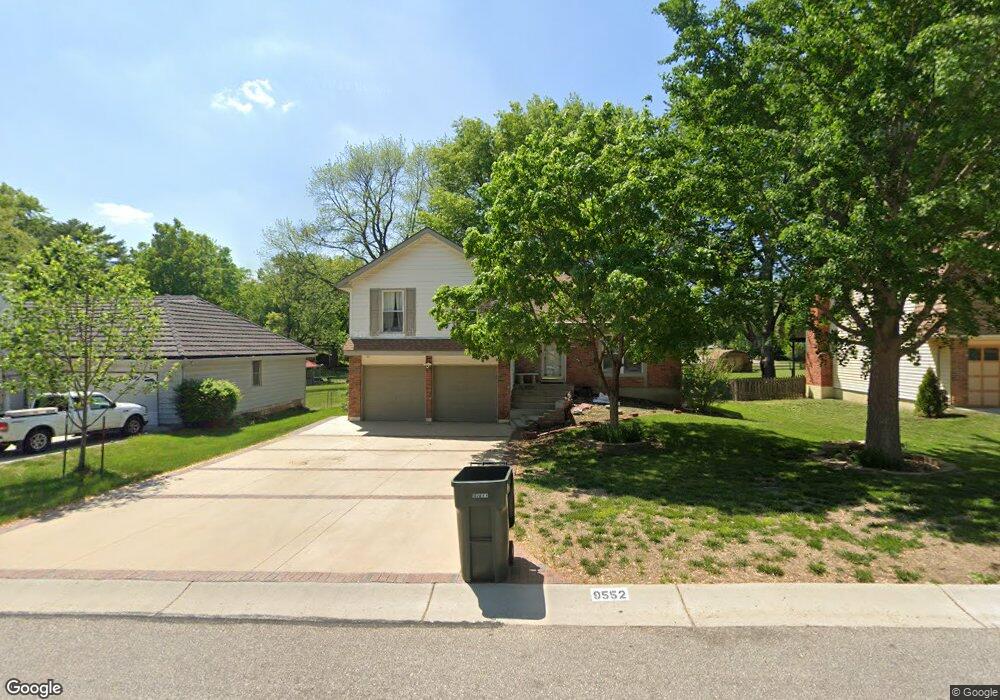
9552 Haskins St Lenexa, KS 66215
Estimated Value: $315,000 - $340,000
3
Beds
2
Baths
1,245
Sq Ft
$263/Sq Ft
Est. Value
About This Home
This home is located at 9552 Haskins St, Lenexa, KS 66215 and is currently estimated at $327,220, approximately $262 per square foot. 9552 Haskins St is a home located in Johnson County with nearby schools including Sunflower Elementary School, Westridge Middle School, and Shawnee Mission West High School.
Ownership History
Date
Name
Owned For
Owner Type
Purchase Details
Closed on
Mar 12, 2021
Sold by
Delreal Alonzo Del and Real Alisa V
Bought by
Frihart Phillip and Frihart Alexandra
Current Estimated Value
Home Financials for this Owner
Home Financials are based on the most recent Mortgage that was taken out on this home.
Original Mortgage
$230,743
Outstanding Balance
$204,956
Interest Rate
2.7%
Mortgage Type
FHA
Estimated Equity
$122,264
Purchase Details
Closed on
Oct 5, 2007
Sold by
Porterfield Russell and Porterfield Sue J
Bought by
Real Alonzo Del and Real Alisa V Del
Home Financials for this Owner
Home Financials are based on the most recent Mortgage that was taken out on this home.
Original Mortgage
$158,300
Interest Rate
6.32%
Mortgage Type
VA
Create a Home Valuation Report for This Property
The Home Valuation Report is an in-depth analysis detailing your home's value as well as a comparison with similar homes in the area
Home Values in the Area
Average Home Value in this Area
Purchase History
| Date | Buyer | Sale Price | Title Company |
|---|---|---|---|
| Frihart Phillip | -- | Platinum Title Llc | |
| Real Alonzo Del | -- | Midwest Title Co Inc |
Source: Public Records
Mortgage History
| Date | Status | Borrower | Loan Amount |
|---|---|---|---|
| Open | Frihart Phillip | $230,743 | |
| Previous Owner | Real Alonzo Del | $158,300 |
Source: Public Records
Tax History
| Year | Tax Paid | Tax Assessment Tax Assessment Total Assessment is a certain percentage of the fair market value that is determined by local assessors to be the total taxable value of land and additions on the property. | Land | Improvement |
|---|---|---|---|---|
| 2025 | $3,700 | $34,466 | $6,215 | $28,251 |
| 2024 | $3,700 | $33,592 | $5,647 | $27,945 |
| 2023 | $3,753 | $33,316 | $5,129 | $28,187 |
| 2022 | $3,162 | $28,025 | $4,662 | $23,363 |
| 2021 | $3,035 | $25,415 | $4,434 | $20,981 |
| 2020 | $2,859 | $23,679 | $4,031 | $19,648 |
| 2019 | $2,642 | $21,838 | $3,360 | $18,478 |
| 2018 | $2,545 | $20,838 | $3,360 | $17,478 |
| 2017 | $2,510 | $19,918 | $3,058 | $16,860 |
| 2016 | $2,370 | $18,550 | $3,057 | $15,493 |
| 2015 | $2,242 | $17,653 | $3,080 | $14,573 |
| 2013 | -- | $17,055 | $3,080 | $13,975 |
Source: Public Records
Map
Nearby Homes
- 9938 Fair Lane Rd
- 9901 Countryside Rd
- 13013 W 101st St
- 9914 Westgate Ln
- 10020 Century Ln
- 12325 W 100th St
- 10007 Monrovia St
- 12022 W 100th St
- 12407 W 102nd St
- 9029 Acuff Ln
- 11800 W 99th Place
- 10250 Caenen Dr
- 8740 Park St
- 10139 Earnshaw St
- 9212 Constance St
- 14900 W 91st Terrace
- 10301 Garnett St
- 14640 W 90th St
- 15113 W 91st Place
- 12400 W 105th Terrace
- 9548 Haskins St
- 9544 Haskins St
- 9600 Haskins Dr
- 9600 Haskins St
- 13226 W 96th St
- 9540 Haskins St
- 13400 W 96th Terrace
- 13406 W 96th Terrace
- 9547 Haskins St
- 13227 W 96th St
- 13308 W 96th Terrace
- 13218 W 96th St
- 9534 Haskins St
- 9541 Haskins St
- 13300 W 96th Terrace
- 13223 W 96th St
- 13412 W 96th Terrace
- 9621 Pflumm Rd
- 13212 W 96th St
- 9533 Haskins St
Your Personal Tour Guide
Ask me questions while you tour the home.