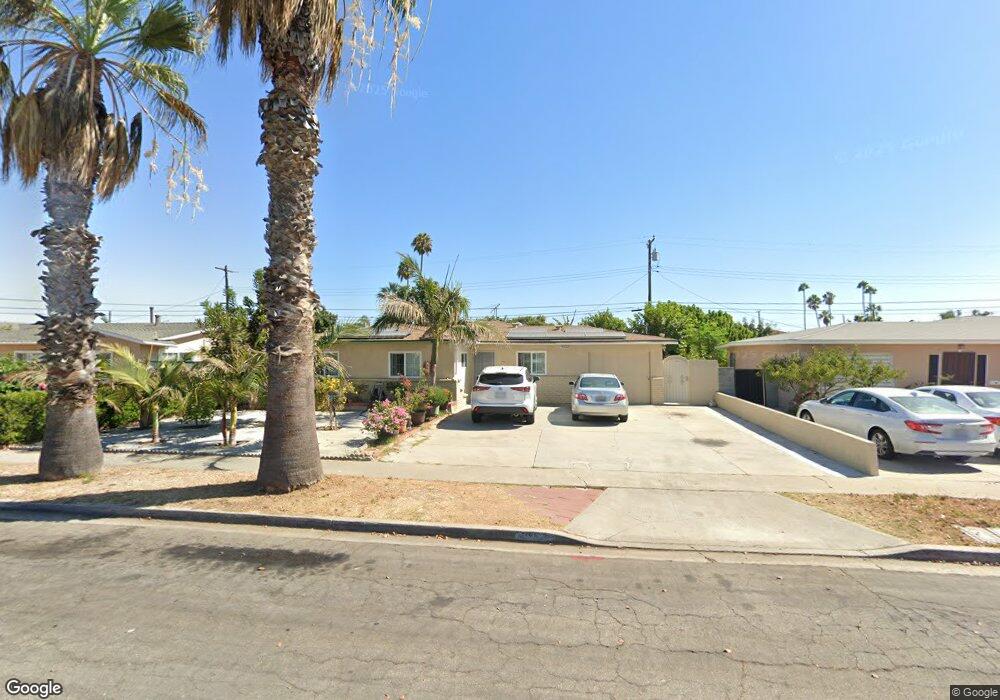
9552 Mirage Ave Garden Grove, CA 92844
Little Saigon NeighborhoodEstimated Value: $975,000 - $1,134,106
4
Beds
3
Baths
1,925
Sq Ft
$552/Sq Ft
Est. Value
About This Home
This home is located at 9552 Mirage Ave, Garden Grove, CA 92844 and is currently estimated at $1,062,027, approximately $551 per square foot. 9552 Mirage Ave is a home located in Orange County with nearby schools including Merton E. Hill Elementary School, Donald S. Jordan Intermediate School, and Bolsa Grande High School.
Ownership History
Date
Name
Owned For
Owner Type
Purchase Details
Closed on
Dec 13, 2022
Sold by
Vu Ta Tien and Vu Cuc Thi
Bought by
Ta Tien Vu And Cuc Thi Truong Family Trust
Current Estimated Value
Purchase Details
Closed on
Apr 13, 2001
Sold by
Vu Ta Tien and Vu Chau Ngoc
Bought by
Vu Ta Tien
Purchase Details
Closed on
Jan 14, 2000
Sold by
Truong Cuc Thi
Bought by
Vu Ta Tien
Home Financials for this Owner
Home Financials are based on the most recent Mortgage that was taken out on this home.
Original Mortgage
$165,000
Interest Rate
7.84%
Purchase Details
Closed on
Jan 13, 2000
Sold by
Ngoc Quach Vuong and Ngoc My Lan
Bought by
Vu Ta Tien and Vu Chau Ngoc
Home Financials for this Owner
Home Financials are based on the most recent Mortgage that was taken out on this home.
Original Mortgage
$165,000
Interest Rate
7.84%
Create a Home Valuation Report for This Property
The Home Valuation Report is an in-depth analysis detailing your home's value as well as a comparison with similar homes in the area
Home Values in the Area
Average Home Value in this Area
Purchase History
| Date | Buyer | Sale Price | Title Company |
|---|---|---|---|
| Ta Tien Vu And Cuc Thi Truong Family Trust | -- | -- | |
| Vu Ta Tien | -- | -- | |
| Vu Ta Tien | -- | American Title | |
| Vu Ta Tien | -- | American Title Co | |
| Vu Ta Tien | $187,000 | American Title Co |
Source: Public Records
Mortgage History
| Date | Status | Borrower | Loan Amount |
|---|---|---|---|
| Previous Owner | Vu Ta Tien | $165,000 |
Source: Public Records
Tax History Compared to Growth
Tax History
| Year | Tax Paid | Tax Assessment Tax Assessment Total Assessment is a certain percentage of the fair market value that is determined by local assessors to be the total taxable value of land and additions on the property. | Land | Improvement |
|---|---|---|---|---|
| 2025 | $4,703 | $377,172 | $231,222 | $145,950 |
| 2024 | $4,703 | $369,777 | $226,688 | $143,089 |
| 2023 | $4,613 | $362,527 | $222,243 | $140,284 |
| 2022 | $4,513 | $355,419 | $217,885 | $137,534 |
| 2021 | $4,464 | $348,450 | $213,612 | $134,838 |
| 2020 | $4,405 | $344,878 | $211,422 | $133,456 |
| 2019 | $4,321 | $338,116 | $207,276 | $130,840 |
| 2018 | $4,234 | $331,487 | $203,212 | $128,275 |
| 2017 | $4,175 | $324,988 | $199,228 | $125,760 |
| 2016 | $3,970 | $318,616 | $195,321 | $123,295 |
| 2015 | $3,054 | $239,137 | $192,388 | $46,749 |
| 2014 | $2,980 | $234,453 | $188,619 | $45,834 |
Source: Public Records
Map
Nearby Homes
- 9200 Westminster Blvd Unit 25
- 14362 Bushard St Unit 39
- 14362 Bushard St Unit 109
- 9141 Jennrich Ave
- 9906 13th St
- 9884 11th St
- 10061 15th St
- 14171 Flower St
- 8866 Grandville Cir
- 13839 Magnolia St
- 9175 Sabre Ln
- 13711 Magnolia St
- 8902 Mcclure Ave
- 8784 Hewitt Place Unit 12
- 14431 Nola St
- 9851 Bolsa Ave Unit 198
- 9851 Bolsa Ave Unit 196
- 9691 Central Ave
- 13392 Magnolia St
- 13262 Verde St
- 9572 Mirage Ave
- 9542 Mirage Ave
- 9561 Reading Ave
- 9571 Reading Ave
- 9541 Reading Ave
- 9582 Mirage Ave
- 9532 Mirage Ave
- 9551 Mirage Ave
- 14141 Erin Rd
- 9531 Reading Ave
- 9541 Mirage Ave
- 9571 Mirage Ave
- 9512 Mirage Ave
- 9531 Mirage Ave
- 9581 Mirage Ave
- 9521 Reading Ave
- 9511 Mirage Ave
- 9502 Mirage Ave
- 14112 Erin Rd
- 14132 Erin Rd