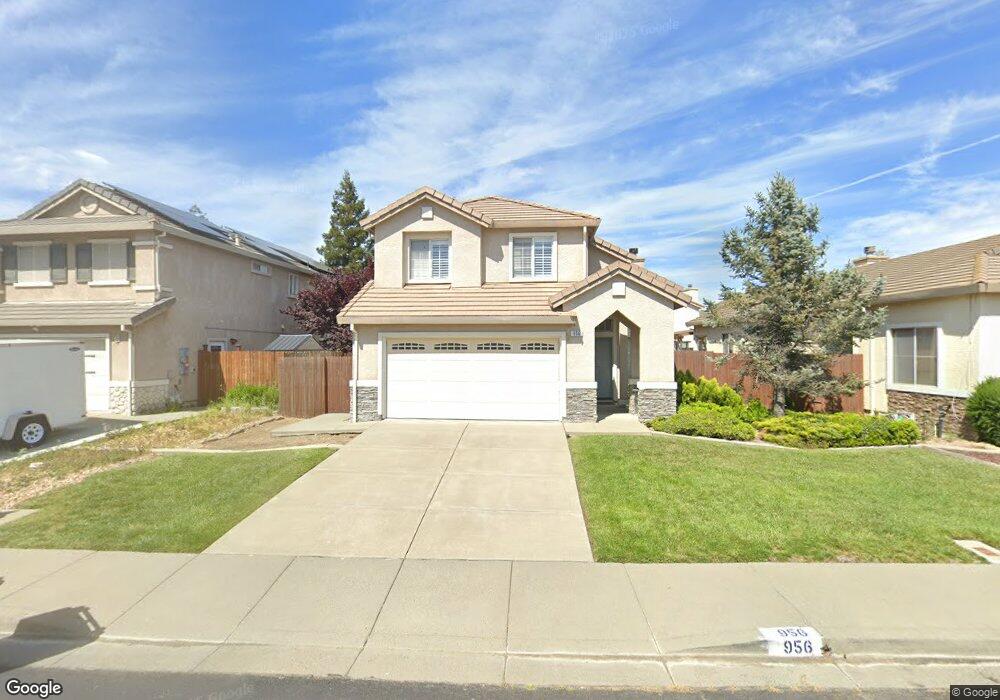
956 Celestine Cir Vacaville, CA 95687
Estimated Value: $590,654 - $617,000
3
Beds
3
Baths
1,803
Sq Ft
$337/Sq Ft
Est. Value
About This Home
This home is located at 956 Celestine Cir, Vacaville, CA 95687 and is currently estimated at $607,164, approximately $336 per square foot. 956 Celestine Cir is a home located in Solano County with nearby schools including Foxboro Elementary School, Golden West Middle School, and Vanden High School.
Ownership History
Date
Name
Owned For
Owner Type
Purchase Details
Closed on
May 24, 2012
Sold by
Wise Jeffrey
Bought by
Wise Jeffrey
Current Estimated Value
Home Financials for this Owner
Home Financials are based on the most recent Mortgage that was taken out on this home.
Original Mortgage
$377,760
Outstanding Balance
$261,116
Interest Rate
3.85%
Mortgage Type
New Conventional
Estimated Equity
$346,048
Purchase Details
Closed on
Nov 22, 2006
Sold by
Wise Jeffrey and Wise Marilou
Bought by
Wise Jeffrey
Home Financials for this Owner
Home Financials are based on the most recent Mortgage that was taken out on this home.
Original Mortgage
$384,000
Interest Rate
6.37%
Mortgage Type
New Conventional
Purchase Details
Closed on
Dec 12, 1997
Sold by
West Coast Home Builders Inc
Bought by
Wise Jeffrey and Wise Marilou
Home Financials for this Owner
Home Financials are based on the most recent Mortgage that was taken out on this home.
Original Mortgage
$167,943
Interest Rate
7.16%
Mortgage Type
VA
Create a Home Valuation Report for This Property
The Home Valuation Report is an in-depth analysis detailing your home's value as well as a comparison with similar homes in the area
Purchase History
| Date | Buyer | Sale Price | Title Company |
|---|---|---|---|
| Wise Jeffrey | -- | Old Republic Title Company | |
| Wise Jeffrey | -- | Servicelink Division | |
| Wise Jeffrey | $165,000 | -- |
Source: Public Records
Mortgage History
| Date | Status | Borrower | Loan Amount |
|---|---|---|---|
| Open | Wise Jeffrey | $377,760 | |
| Closed | Wise Jeffrey | $384,000 | |
| Closed | Wise Jeffrey | $167,943 |
Source: Public Records
Tax History
| Year | Tax Paid | Tax Assessment Tax Assessment Total Assessment is a certain percentage of the fair market value that is determined by local assessors to be the total taxable value of land and additions on the property. | Land | Improvement |
|---|---|---|---|---|
| 2025 | $3,666 | $264,335 | $63,865 | $200,470 |
| 2024 | $3,666 | $259,153 | $62,613 | $196,540 |
| 2023 | $3,565 | $254,073 | $61,386 | $192,687 |
| 2022 | $3,483 | $249,092 | $60,183 | $188,909 |
| 2021 | $3,479 | $244,208 | $59,003 | $185,205 |
| 2020 | $3,450 | $241,704 | $58,398 | $183,306 |
| 2019 | $3,379 | $236,965 | $57,253 | $179,712 |
| 2018 | $3,326 | $232,320 | $56,131 | $176,189 |
| 2017 | $3,224 | $227,766 | $55,031 | $172,735 |
| 2016 | $3,176 | $223,301 | $53,952 | $169,349 |
| 2015 | $3,141 | $219,948 | $53,142 | $166,806 |
| 2014 | $3,094 | $215,641 | $52,102 | $163,539 |
Source: Public Records
Map
Nearby Homes
- 897 Sapphire Cir
- 805 Broadfork Cir
- 967 Copper Way
- 3007 Norwich Ct
- 1007 Canterbury Ct
- 954 Iron Dr
- 766 Calico Trail
- 821 Saddle Horn Trail
- 448 Potters Ln
- 196 Somerville Dr
- 7079 Westminster Ct
- 531 Colonial Cir
- 100 Mechanic Ln
- 2361 Newcastle Dr
- 250 Somerville Dr
- 437 Jerrylee Rd
- 116 Heritage Ln
- 107 Mechanic Ln
- 339 Aaron Cir
- 196 Caldwell Dr
- 960 Celestine Cir
- 952 Celestine Cir
- 948 Celestine Cir
- 964 Celestine Cir
- 905 Sapphire Cir
- 909 Sapphire Cir
- 901 Sapphire Cir
- 913 Sapphire Cir
- 944 Celestine Cir
- 961 Celestine Cir
- 965 Celestine Cir
- 957 Celestine Cir
- 969 Celestine Cir
- 953 Celestine Cir
- 973 Celestine Cir
- 940 Celestine Cir
- 949 Celestine Cir
- 893 Sapphire Cir
- 945 Celestine Cir
- 936 Celestine Cir
Your Personal Tour Guide
Ask me questions while you tour the home.