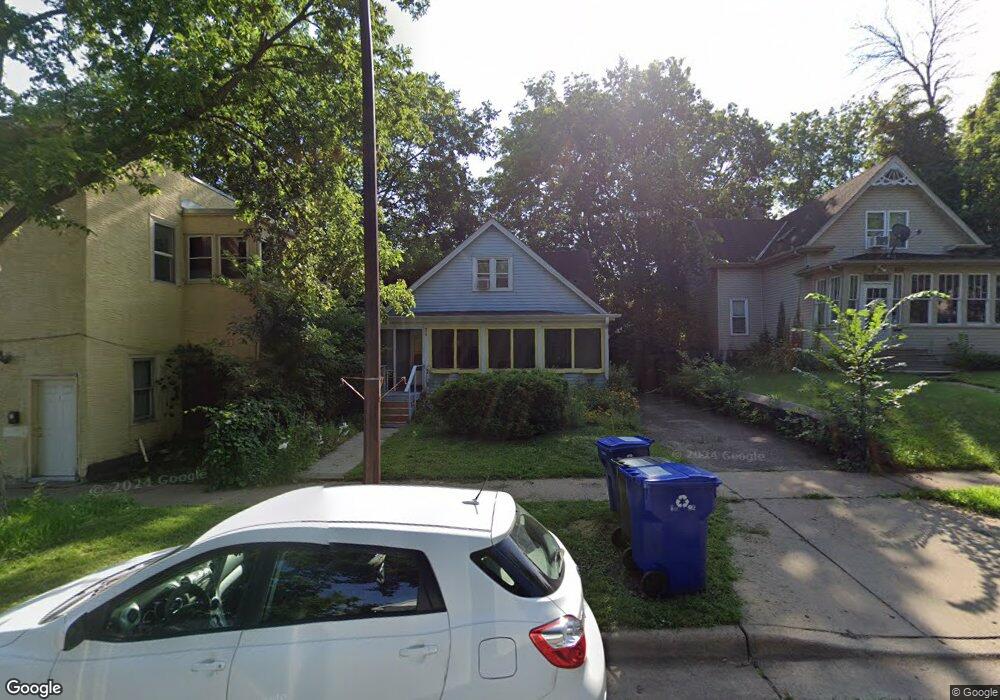
956 Clark St Saint Paul, MN 55130
Payne-Phalen NeighborhoodEstimated Value: $203,174 - $239,000
3
Beds
1
Bath
1,138
Sq Ft
$189/Sq Ft
Est. Value
About This Home
This home is located at 956 Clark St, Saint Paul, MN 55130 and is currently estimated at $214,794, approximately $188 per square foot. 956 Clark St is a home located in Ramsey County with nearby schools including Bruce F Vento Elementary School, Uncommon Schools Camden Prep - Mt. Ephraim Campus, and Washington Technology Magnet School.
Ownership History
Date
Name
Owned For
Owner Type
Purchase Details
Closed on
Jul 26, 2019
Sold by
Robey Todd and Robey Katherine
Bought by
Mohamed Jawahir A
Current Estimated Value
Home Financials for this Owner
Home Financials are based on the most recent Mortgage that was taken out on this home.
Original Mortgage
$137,740
Outstanding Balance
$120,882
Interest Rate
3.8%
Mortgage Type
New Conventional
Estimated Equity
$93,912
Purchase Details
Closed on
Jan 15, 2010
Sold by
Federal National Mortgage Association
Bought by
T J A Williams Investments Llc
Create a Home Valuation Report for This Property
The Home Valuation Report is an in-depth analysis detailing your home's value as well as a comparison with similar homes in the area
Home Values in the Area
Average Home Value in this Area
Purchase History
| Date | Buyer | Sale Price | Title Company |
|---|---|---|---|
| Mohamed Jawahir A | $142,000 | Edina Realty Title Inc | |
| T J A Williams Investments Llc | $35,000 | -- |
Source: Public Records
Mortgage History
| Date | Status | Borrower | Loan Amount |
|---|---|---|---|
| Open | Mohamed Jawahir A | $137,740 |
Source: Public Records
Tax History Compared to Growth
Tax History
| Year | Tax Paid | Tax Assessment Tax Assessment Total Assessment is a certain percentage of the fair market value that is determined by local assessors to be the total taxable value of land and additions on the property. | Land | Improvement |
|---|---|---|---|---|
| 2025 | $2,760 | $194,400 | $25,000 | $169,400 |
| 2023 | $2,760 | $190,100 | $20,000 | $170,100 |
| 2022 | $2,160 | $191,300 | $20,000 | $171,300 |
| 2021 | $1,666 | $150,600 | $20,000 | $130,600 |
| 2020 | $1,824 | $125,500 | $6,700 | $118,800 |
| 2019 | $1,500 | $119,600 | $6,700 | $112,900 |
| 2018 | $1,192 | $108,400 | $6,700 | $101,700 |
| 2017 | $976 | $94,300 | $6,700 | $87,600 |
| 2016 | $1,082 | $0 | $0 | $0 |
| 2015 | $1,236 | $89,200 | $6,700 | $82,500 |
| 2014 | $1,038 | $0 | $0 | $0 |
Source: Public Records
Map
Nearby Homes