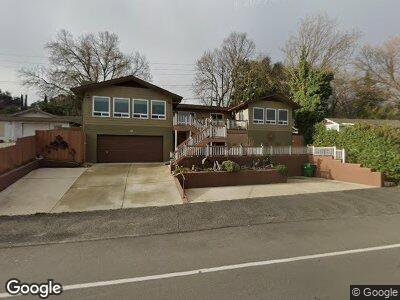
9576 Marchant Way Atascadero, CA 93422
Estimated Value: $796,975 - $1,025,000
3
Beds
3
Baths
1,950
Sq Ft
$460/Sq Ft
Est. Value
About This Home
This home is located at 9576 Marchant Way, Atascadero, CA 93422 and is currently estimated at $897,494, approximately $460 per square foot. 9576 Marchant Way is a home located in San Luis Obispo County with nearby schools including San Gabriel Elementary School, Atascadero Middle School, and Atascadero High School.
Ownership History
Date
Name
Owned For
Owner Type
Purchase Details
Closed on
Apr 2, 2021
Sold by
Hillstrom Been Beverly Jean
Bought by
Hillstrom Been Beverly and Hillstrom Bean 2021 Revocable
Current Estimated Value
Purchase Details
Closed on
Mar 8, 2021
Sold by
Bean Dennis Lee and Hillstrom Bean Beverly
Bought by
Hillstrom Bean Beverly Jean
Purchase Details
Closed on
Jul 6, 2005
Sold by
Scroggs Donald D and Scroggs Elizabeth A
Bought by
Bean Dennis Lee and Hillstrom Bean Beverly Jean
Home Financials for this Owner
Home Financials are based on the most recent Mortgage that was taken out on this home.
Original Mortgage
$64,900
Interest Rate
5.51%
Mortgage Type
Credit Line Revolving
Create a Home Valuation Report for This Property
The Home Valuation Report is an in-depth analysis detailing your home's value as well as a comparison with similar homes in the area
Home Values in the Area
Average Home Value in this Area
Purchase History
| Date | Buyer | Sale Price | Title Company |
|---|---|---|---|
| Hillstrom Been Beverly | -- | None Available | |
| Bean Dennis Lee | $650,000 | Fidelity Title Company |
Source: Public Records
Mortgage History
| Date | Status | Borrower | Loan Amount |
|---|---|---|---|
| Open | Bean Dennis Lee | $200,000 | |
| Closed | Bean Dennis Lee | $64,900 | |
| Open | Bean Dennis Lee | $519,900 | |
| Previous Owner | Scroggs Donald D | $70,000 | |
| Previous Owner | Scroggs Donald D | $143,000 | |
| Previous Owner | Scroggs Donald D | $140,000 | |
| Previous Owner | Scroggs Donald D | $120,000 |
Source: Public Records
Tax History Compared to Growth
Tax History
| Year | Tax Paid | Tax Assessment Tax Assessment Total Assessment is a certain percentage of the fair market value that is determined by local assessors to be the total taxable value of land and additions on the property. | Land | Improvement |
|---|---|---|---|---|
| 2024 | $6,473 | $537,681 | $281,760 | $255,921 |
| 2023 | $6,473 | $527,139 | $276,236 | $250,903 |
| 2022 | $6,306 | $516,804 | $270,820 | $245,984 |
| 2021 | $6,113 | $506,671 | $265,510 | $241,161 |
| 2020 | $5,988 | $501,477 | $262,788 | $238,689 |
| 2019 | $5,817 | $491,645 | $257,636 | $234,009 |
| 2018 | $5,665 | $482,006 | $252,585 | $229,421 |
| 2017 | $5,558 | $472,556 | $247,633 | $224,923 |
| 2016 | $5,452 | $463,291 | $242,778 | $220,513 |
| 2015 | $5,371 | $456,333 | $239,132 | $217,201 |
| 2014 | $4,926 | $447,395 | $234,448 | $212,947 |
Source: Public Records
Map
Nearby Homes
- 8092 Santa Rosa Rd
- 8035 Santa Rosa Rd
- 8865 San Gabriel Rd
- 8055 Portola Rd Unit A
- 8745 Portola Rd
- 9019 San Gabriel Rd
- 10097 Atascadero Ave
- 7858 Curbaril Ave Unit 3
- 7902 Curbaril Ave
- 7955 Morro Rd
- 8825 Old Santa Rosa Rd
- 8362 Carmelita Ave
- 8390 Curbaril Ave
- 8160 Los Osos Rd
- 8850 El Camino Real Unit 9
- 8850 El Camino Real Unit 3
- 7785 Navajoa Ave
- 7605 Morro Rd
- 9098 San Gabriel Rd
- 8270 San Marcos Rd
- 9576 Marchant Way
- 9580 Marchant Way
- 9570 Marchant Way
- 9590 Marchant Way
- 8090 Santa Rosa Rd
- 8150 Santa Rosa Rd
- 9550 Marchant Way
- 8100 Santa Rosa Rd
- 8070 Santa Rosa Rd
- 9530 Marchant Way
- 8050 Santa Rosa Rd
- 9520 Marchant Way
- 8170 Santa Rosa Rd
- 8200 Santa Rosa Rd
- 9510 Marchant Way
- 8152 Santa Rosa Rd
- 8025 Santa Rosa Rd
- 8140 Santa Rosa Rd
- 8080 Santa Rosa Rd
- 8030 Santa Rosa Rd