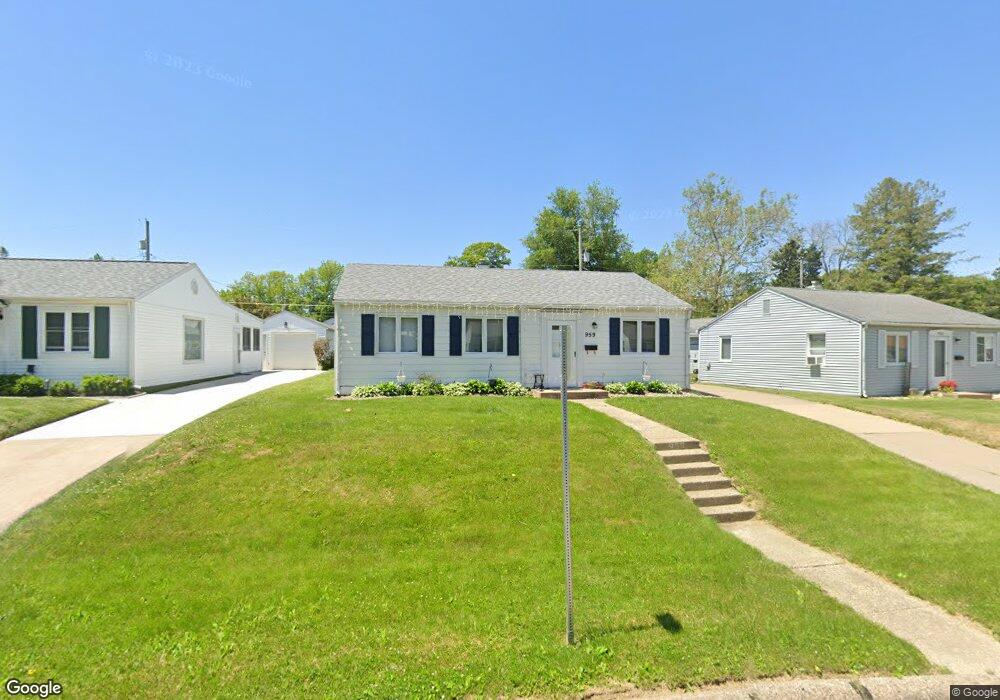
959 40th St Moline, IL 61265
Estimated Value: $101,000 - $112,000
Studio
--
Bath
936
Sq Ft
$112/Sq Ft
Est. Value
About This Home
This home is located at 959 40th St, Moline, IL 61265 and is currently estimated at $104,988, approximately $112 per square foot. 959 40th St is a home located in Rock Island County with nearby schools including George Washington Elementary School, Woodrow Wilson Middle School, and Moline Sr High School.
Ownership History
Date
Name
Owned For
Owner Type
Purchase Details
Closed on
May 8, 2019
Sold by
Schoonmaker Kevin T and Schoonmaker Margaret L
Bought by
Verbeke Keith E and Verbeke Tamara A
Current Estimated Value
Home Financials for this Owner
Home Financials are based on the most recent Mortgage that was taken out on this home.
Original Mortgage
$156,800
Outstanding Balance
$137,579
Interest Rate
4.1%
Mortgage Type
New Conventional
Estimated Equity
-$32,591
Create a Home Valuation Report for This Property
The Home Valuation Report is an in-depth analysis detailing your home's value as well as a comparison with similar homes in the area
Home Values in the Area
Average Home Value in this Area
Purchase History
| Date | Buyer | Sale Price | Title Company |
|---|---|---|---|
| Verbeke Keith E | $63,000 | Moens Law Offices Chartered |
Source: Public Records
Mortgage History
| Date | Status | Borrower | Loan Amount |
|---|---|---|---|
| Open | Verbeke Keith E | $156,800 |
Source: Public Records
Tax History
| Year | Tax Paid | Tax Assessment Tax Assessment Total Assessment is a certain percentage of the fair market value that is determined by local assessors to be the total taxable value of land and additions on the property. | Land | Improvement |
|---|---|---|---|---|
| 2024 | $2,697 | $30,569 | $4,838 | $25,731 |
| 2023 | $2,697 | $26,056 | $4,625 | $21,431 |
| 2022 | $2,371 | $26,056 | $4,625 | $21,431 |
| 2021 | $2,363 | $24,886 | $4,417 | $20,469 |
| 2020 | $2,374 | $24,738 | $4,391 | $20,347 |
| 2019 | $2,334 | $24,158 | $4,288 | $19,870 |
| 2018 | $2,299 | $24,071 | $4,237 | $19,834 |
| 2017 | $2,248 | $23,576 | $4,150 | $19,426 |
| 2016 | $2,222 | $23,182 | $4,081 | $19,101 |
| 2015 | $2,175 | $22,705 | $3,997 | $18,708 |
| 2014 | $521 | $22,350 | $3,935 | $18,415 |
| 2013 | $521 | $22,350 | $3,935 | $18,415 |
Source: Public Records
Map
Nearby Homes
Your Personal Tour Guide
Ask me questions while you tour the home.