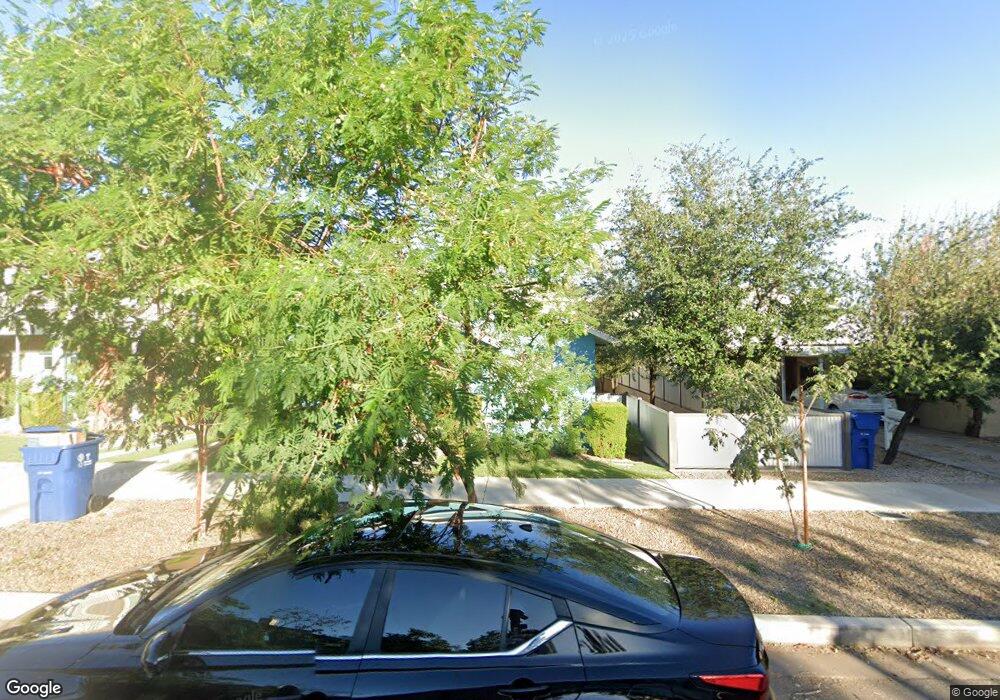
959 S Ash Ave Unit 1002 Tempe, AZ 85281
Maple Ash NeighborhoodEstimated Value: $832,000 - $4,378,000
3
Beds
3
Baths
2,000
Sq Ft
$1,421/Sq Ft
Est. Value
About This Home
This home is located at 959 S Ash Ave Unit 1002, Tempe, AZ 85281 and is currently estimated at $2,842,065, approximately $1,421 per square foot. 959 S Ash Ave Unit 1002 is a home located in Maricopa County with nearby schools including Geneva Epps Mosley Middle School, Tempe High School, and New School for the Arts & Academics.
Ownership History
Date
Name
Owned For
Owner Type
Purchase Details
Closed on
Jul 22, 2022
Sold by
Landalco Llc
Bought by
Night Owl Investments Llc
Current Estimated Value
Home Financials for this Owner
Home Financials are based on the most recent Mortgage that was taken out on this home.
Original Mortgage
$1,750,000
Outstanding Balance
$1,300,548
Interest Rate
5.78%
Mortgage Type
New Conventional
Estimated Equity
$1,541,517
Purchase Details
Closed on
Mar 17, 2021
Sold by
Cranmer Elizabeth and The Cranmer Family Trust
Bought by
Landalco Llc
Purchase Details
Closed on
Aug 30, 2018
Sold by
Ash Property Resurrection Llc
Bought by
Cranmer Lee D and Cranmer Elizabeth
Purchase Details
Closed on
Mar 25, 2009
Sold by
Royse Edward E and Royse Melany Stephanie
Bought by
Menting Irene
Purchase Details
Closed on
Jul 19, 1999
Sold by
Royse Helen L
Bought by
Royse Helen L
Create a Home Valuation Report for This Property
The Home Valuation Report is an in-depth analysis detailing your home's value as well as a comparison with similar homes in the area
Home Values in the Area
Average Home Value in this Area
Purchase History
| Date | Buyer | Sale Price | Title Company |
|---|---|---|---|
| Night Owl Investments Llc | $3,900,000 | Title Security Agency | |
| Landalco Llc | $3,550,000 | Old Republic Title Agency | |
| Cranmer Lee D | $2,750,000 | American Title Service Agenc | |
| Menting Irene | -- | The Talon Group | |
| Menting Irene | $295,000 | The Talon Group Tempe Rural | |
| Royse Helen L | -- | None Available |
Source: Public Records
Mortgage History
| Date | Status | Borrower | Loan Amount |
|---|---|---|---|
| Open | Night Owl Investments Llc | $1,750,000 |
Source: Public Records
Tax History Compared to Growth
Tax History
| Year | Tax Paid | Tax Assessment Tax Assessment Total Assessment is a certain percentage of the fair market value that is determined by local assessors to be the total taxable value of land and additions on the property. | Land | Improvement |
|---|---|---|---|---|
| 2025 | $12,975 | $108,250 | -- | -- |
| 2024 | $11,980 | $103,095 | -- | -- |
| 2023 | $11,980 | $322,420 | $64,480 | $257,940 |
| 2022 | $11,491 | $305,820 | $61,160 | $244,660 |
| 2021 | $11,571 | $2,550,200 | $510,000 | $2,040,200 |
| 2020 | $11,220 | $150,100 | $30,020 | $120,080 |
| 2019 | $11,007 | $123,410 | $24,680 | $98,730 |
| 2018 | $10,733 | $103,220 | $20,640 | $82,580 |
| 2017 | $10,414 | $85,300 | $17,060 | $68,240 |
| 2016 | $10,341 | $82,920 | $16,580 | $66,340 |
| 2015 | $9,932 | $85,200 | $17,040 | $68,160 |
Source: Public Records
Map
Nearby Homes
- 117 W 10th St
- 942 S Ash Ave Unit 103
- 1101 S Farmer Ave
- 1190 S Maple Ave Unit 1
- 1224 S Maple Ave
- 1218 S Farmer Ave
- 522 W Howe St
- 626 S Wilson St
- 421 W 6th St Unit 1003
- 1234 S Farmer Ave
- 21 E 6th St Unit 316
- 21 E 6th St Unit 412
- 21 E 6th St Unit 507
- 21 E 6th St Unit 614
- 606 S Wilson St
- 63 W 13th St Unit 63 & 69
- 505 W 6th St
- 620 W Howe St
- 548 S Wilson St Unit 104
- 14 E 14th St
- 959 S Ash Ave
- 959 S Ash Ave Unit 1003
- 959 S Ash Ave Unit 1004
- 959 S Ash Ave Unit 1001
- 959 S Ash Ave
- 961 S Ash Ave
- 961 S Ash Ave Unit 100
- 943 S Ash Ave
- 925 S Ash Ave Unit 1003
- 925 S Ash Ave Unit 1004
- 925 S Ash Ave Unit 1001
- 925 S Ash Ave Unit 1002
- 925 S Ash Ave
- 925 S Ash Ave
- 907 S Ash Ave
- 905 S Ash Ave
- 905 S Ash Ave Unit Main
- 905 S Ash Ave Unit 1
- 944 S Ash Ave Unit 100
- 940 S Ash Ave