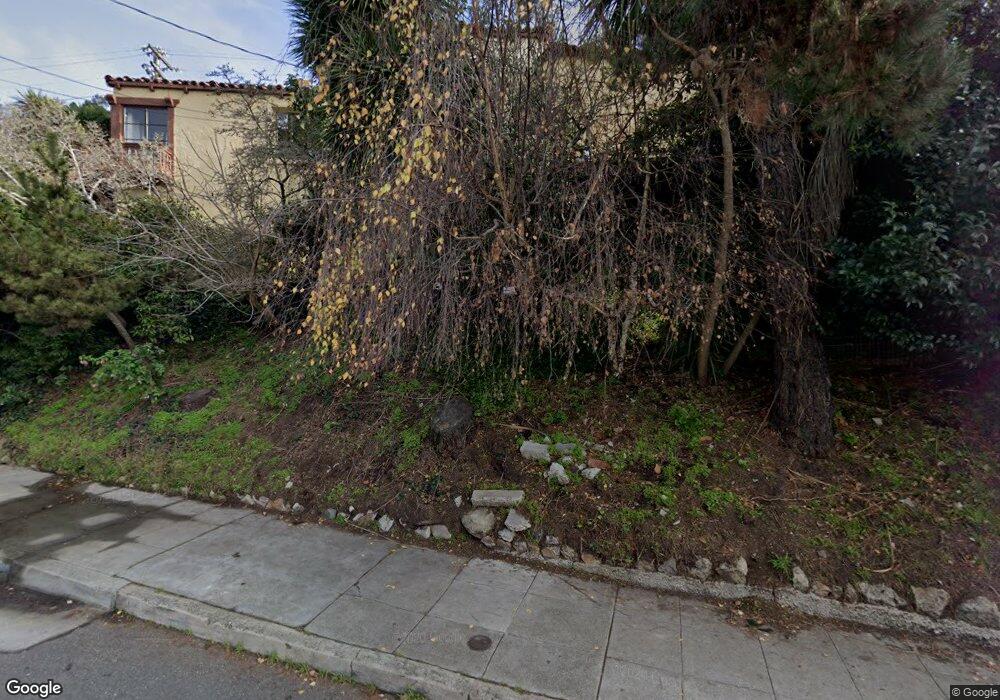
959 Spruce St Berkeley, CA 94707
Berkeley Hills NeighborhoodEstimated Value: $1,837,000 - $2,193,982
3
Beds
4
Baths
2,469
Sq Ft
$809/Sq Ft
Est. Value
About This Home
This home is located at 959 Spruce St, Berkeley, CA 94707 and is currently estimated at $1,998,246, approximately $809 per square foot. 959 Spruce St is a home located in Alameda County with nearby schools including Cragmont Elementary School, Berkeley Arts Magnet at Whittier School, and Washington Elementary School.
Ownership History
Date
Name
Owned For
Owner Type
Purchase Details
Closed on
Jan 11, 2023
Sold by
Collins Kendra
Bought by
Cabin 40 Trust
Current Estimated Value
Purchase Details
Closed on
Sep 17, 2015
Sold by
Strang Eric R and Strang Jennifer Leann
Bought by
Collins Joshua and Collins Kendra
Home Financials for this Owner
Home Financials are based on the most recent Mortgage that was taken out on this home.
Original Mortgage
$787,500
Interest Rate
3.5%
Mortgage Type
Adjustable Rate Mortgage/ARM
Purchase Details
Closed on
Feb 13, 2014
Sold by
Strang Eric R
Bought by
Strang Eric R and Sperry Jennifer Leann
Purchase Details
Closed on
Jan 6, 2014
Sold by
Goehring Noel and Anthenien Ralph A
Bought by
Strang Eric R
Create a Home Valuation Report for This Property
The Home Valuation Report is an in-depth analysis detailing your home's value as well as a comparison with similar homes in the area
Home Values in the Area
Average Home Value in this Area
Purchase History
| Date | Buyer | Sale Price | Title Company |
|---|---|---|---|
| Cabin 40 Trust | -- | -- | |
| Collins Joshua | $1,050,000 | Old Republic Title Company | |
| Strang Eric R | -- | None Available | |
| Strang Eric R | $1,241,000 | Chicago Title Company |
Source: Public Records
Mortgage History
| Date | Status | Borrower | Loan Amount |
|---|---|---|---|
| Previous Owner | Collins Joshua | $787,500 |
Source: Public Records
Tax History
| Year | Tax Paid | Tax Assessment Tax Assessment Total Assessment is a certain percentage of the fair market value that is determined by local assessors to be the total taxable value of land and additions on the property. | Land | Improvement |
|---|---|---|---|---|
| 2025 | $18,796 | $1,235,958 | $414,319 | $828,639 |
| 2024 | $18,796 | $1,211,588 | $406,196 | $812,392 |
| 2023 | $18,406 | $1,194,700 | $398,233 | $796,467 |
| 2022 | $18,076 | $1,164,275 | $390,425 | $780,850 |
| 2021 | $18,122 | $1,141,311 | $382,770 | $765,541 |
| 2020 | $17,146 | $1,136,541 | $378,847 | $757,694 |
| 2019 | $16,472 | $1,114,260 | $371,420 | $742,840 |
| 2018 | $16,196 | $1,092,420 | $364,140 | $728,280 |
| 2017 | $15,646 | $1,071,000 | $357,000 | $714,000 |
| 2016 | $15,150 | $1,050,000 | $350,000 | $700,000 |
| 2015 | $17,862 | $1,265,794 | $379,738 | $886,056 |
| 2014 | $3,480 | $803,631 | $241,089 | $562,542 |
Source: Public Records
Map
Nearby Homes
- 1004 Cragmont Ave
- 826 Indian Rock Ave
- 962 Regal Rd
- 813 San Diego Rd
- 777 Cragmont Ave
- 758 Spruce St
- 770 Santa Barbara Rd
- 1106 Cragmont Ave
- 2315 Eunice St
- 890 Keeler Ave
- 765 San Diego Rd
- 2121 Eunice St
- 982 Grizzly Peak Blvd
- 1950 Hopkins St
- 1024 Grizzly Peak Blvd
- 935 Grizzly Peak Blvd
- 1983 Yosemite Rd
- 731 Grizzly Peak Blvd
- 1165 Cragmont Ave
- 1100 Miller Ave
- 970 Santa Barbara Rd
- 961 Santa Barbara Rd
- 967 Santa Barbara Rd
- 951 Santa Barbara Rd
- 964 Spruce St
- 956 Spruce St
- 948 Santa Barbara Rd
- 945 Santa Barbara Rd
- 974 Santa Barbara Rd
- 975 Santa Barbara Rd
- 972 Spruce St
- 941 Spruce St
- 946 Spruce St
- 976 Spruce St
- 978 Cragmont Ave
- 982 Cragmont Ave
- 987 Spruce St
- 938 Santa Barbara Rd
- 939 San Benito Rd
- 985 Santa Barbara Rd
Your Personal Tour Guide
Ask me questions while you tour the home.