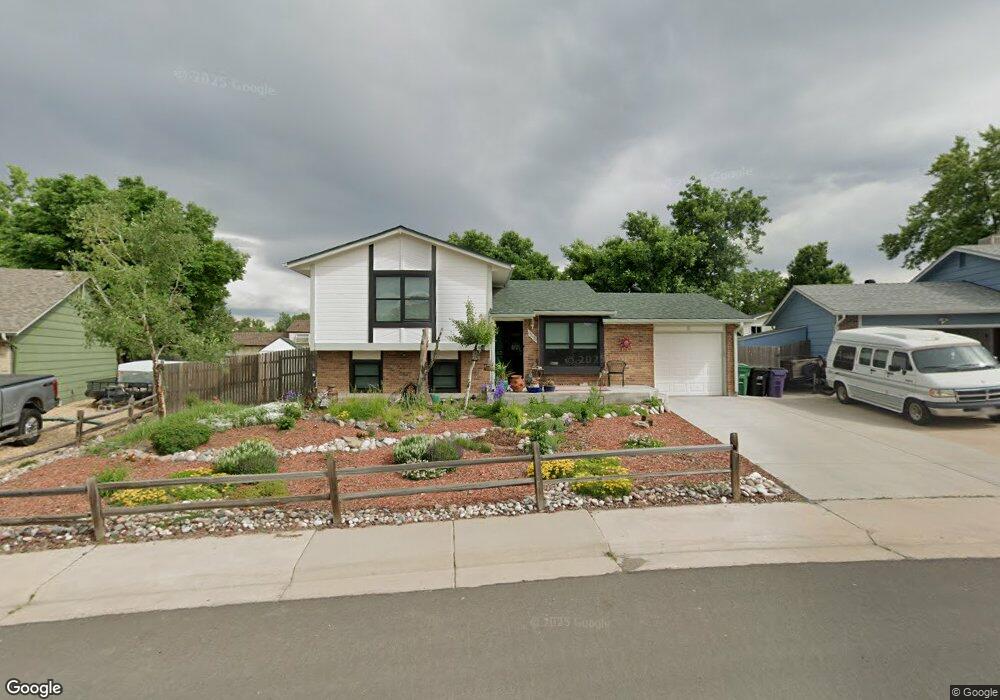
9590 W Chenango Ave Littleton, CO 80123
Marston NeighborhoodEstimated Value: $525,062 - $572,000
4
Beds
2
Baths
898
Sq Ft
$608/Sq Ft
Est. Value
About This Home
This home is located at 9590 W Chenango Ave, Littleton, CO 80123 and is currently estimated at $545,766, approximately $607 per square foot. 9590 W Chenango Ave is a home located in Denver County with nearby schools including Grant Ranch School, John F Kennedy High School, and Montessori Peaks Academy.
Ownership History
Date
Name
Owned For
Owner Type
Purchase Details
Closed on
Sep 25, 2003
Sold by
Chapman C Capucine and Archuleta John M
Bought by
Chapman Carmelita C
Current Estimated Value
Home Financials for this Owner
Home Financials are based on the most recent Mortgage that was taken out on this home.
Original Mortgage
$203,579
Outstanding Balance
$96,368
Interest Rate
6.42%
Mortgage Type
FHA
Estimated Equity
$449,398
Purchase Details
Closed on
Jul 27, 2001
Sold by
Mobley Dora L
Bought by
Chapman C Capucine and Archuleta John M
Home Financials for this Owner
Home Financials are based on the most recent Mortgage that was taken out on this home.
Original Mortgage
$189,033
Interest Rate
7.07%
Mortgage Type
FHA
Purchase Details
Closed on
Aug 15, 1997
Sold by
Kartus John J and Kartus Robin E
Bought by
Ziegler Dora L
Home Financials for this Owner
Home Financials are based on the most recent Mortgage that was taken out on this home.
Original Mortgage
$112,200
Interest Rate
8.75%
Create a Home Valuation Report for This Property
The Home Valuation Report is an in-depth analysis detailing your home's value as well as a comparison with similar homes in the area
Home Values in the Area
Average Home Value in this Area
Purchase History
| Date | Buyer | Sale Price | Title Company |
|---|---|---|---|
| Chapman Carmelita C | -- | -- | |
| Chapman C Capucine | $192,000 | Chicago Title Co | |
| Ziegler Dora L | $132,000 | -- |
Source: Public Records
Mortgage History
| Date | Status | Borrower | Loan Amount |
|---|---|---|---|
| Open | Chapman Carmelita C | $203,579 | |
| Closed | Chapman C Capucine | $189,033 | |
| Previous Owner | Ziegler Dora L | $112,200 |
Source: Public Records
Tax History Compared to Growth
Tax History
| Year | Tax Paid | Tax Assessment Tax Assessment Total Assessment is a certain percentage of the fair market value that is determined by local assessors to be the total taxable value of land and additions on the property. | Land | Improvement |
|---|---|---|---|---|
| 2024 | $2,542 | $32,090 | $1,780 | $30,310 |
| 2023 | $2,487 | $32,090 | $1,780 | $30,310 |
| 2022 | $2,111 | $26,550 | $5,670 | $20,880 |
| 2021 | $2,039 | $27,320 | $5,830 | $21,490 |
| 2020 | $1,957 | $26,380 | $5,830 | $20,550 |
| 2019 | $1,902 | $26,380 | $5,830 | $20,550 |
| 2018 | $1,598 | $20,660 | $5,340 | $15,320 |
| 2017 | $1,594 | $20,660 | $5,340 | $15,320 |
| 2016 | $1,489 | $18,260 | $5,317 | $12,943 |
| 2015 | $1,427 | $18,260 | $5,317 | $12,943 |
| 2014 | $1,044 | $12,570 | $3,980 | $8,590 |
Source: Public Records
Map
Nearby Homes
- 4934 S Flower Way
- 9975 W Wagon Trail Dr
- 4962 S Field Ct
- 4644 S Kipling Cir
- 10250 W Saratoga Place
- 4644 S Garland Way
- 9950 W Progress Place
- 5264 S Jellison St
- 4869 S Dudley St
- 9614 W Arlington Ave
- 4896 S Nelson St
- 5310 S Jellison St
- 4750 S Dudley St Unit 19
- 4750 S Dudley St Unit 1
- 4896 S Dudley St Unit 9-10
- 4896 S Dudley St Unit 8-2
- 4896 S Dudley St Unit 8
- 4896 S Dudley St Unit 7-7
- 4899 S Dudley St Unit E1
- 4899 S Dudley St Unit 11A
- 9550 W Chenango Ave
- 9610 W Chenango Ave
- 9621 W Dumbarton Place
- 9595 W Chenango Ave
- 9500 W Chenango Ave
- 9650 W Chenango Ave
- 9601 W Dumbarton Place
- 9641 W Dumbarton Place
- 9505 W Chenango Ave
- 9661 W Dumbarton Place
- 9511 W Dumbarton Place
- 9680 W Chenango Ave
- 4894 S Iris St
- 9671 W Dumbarton Place
- 4890 S Iris St
- 4889 S Hoyt St
- 4955 S Independence Way
- 4892 S Hoyt St
- 9642 W Dumbarton Place
- 4912 S Hoyt St