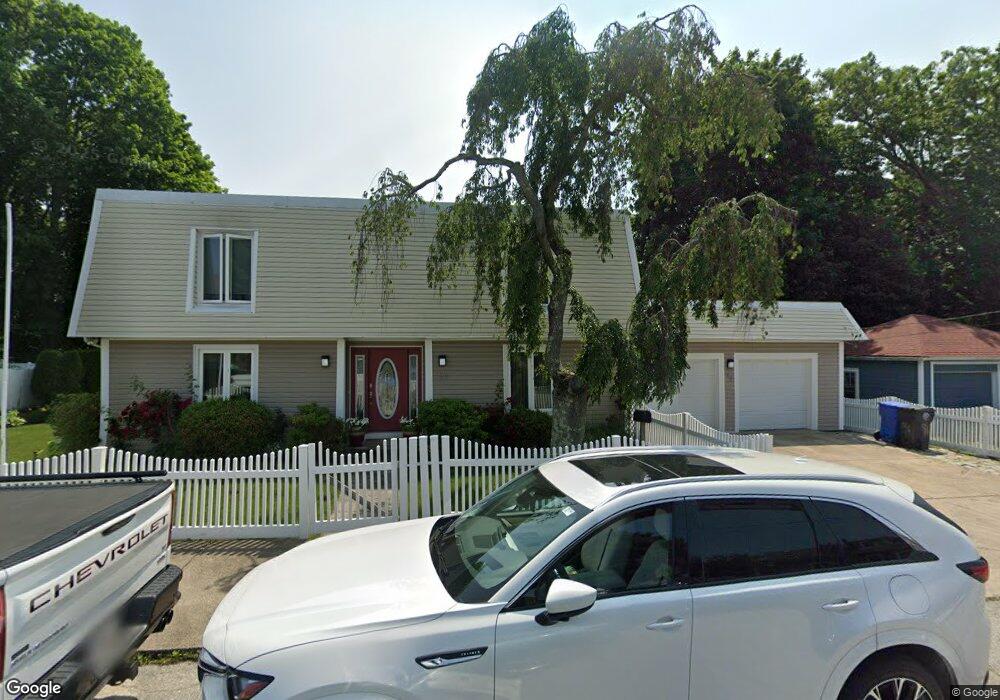
96 Browne St Cranston, RI 02920
Arlington NeighborhoodEstimated Value: $488,000 - $543,493
4
Beds
2
Baths
3,240
Sq Ft
$162/Sq Ft
Est. Value
About This Home
This home is located at 96 Browne St, Cranston, RI 02920 and is currently estimated at $524,623, approximately $161 per square foot. 96 Browne St is a home located in Providence County with nearby schools including Hugh B. Bain Middle School, Cranston High School East, and Achievement First Iluminar Mayoral Academy.
Ownership History
Date
Name
Owned For
Owner Type
Purchase Details
Closed on
Jul 26, 2023
Sold by
Brown Gladys N
Bought by
Brown Gladys N and Benson Katie A
Current Estimated Value
Purchase Details
Closed on
May 10, 2018
Sold by
Brown Gladys N and Asomani Bob B
Bought by
Brown Gladys N
Purchase Details
Closed on
Jul 26, 1999
Sold by
Barkley Donald L and Barkley Marie C
Bought by
Asomani Bob B and Brown Gladys N
Create a Home Valuation Report for This Property
The Home Valuation Report is an in-depth analysis detailing your home's value as well as a comparison with similar homes in the area
Home Values in the Area
Average Home Value in this Area
Purchase History
| Date | Buyer | Sale Price | Title Company |
|---|---|---|---|
| Brown Gladys N | -- | None Available | |
| Brown Gladys N | -- | -- | |
| Asomani Bob B | $110,000 | -- |
Source: Public Records
Mortgage History
| Date | Status | Borrower | Loan Amount |
|---|---|---|---|
| Previous Owner | Asomani Bob B | $192,000 | |
| Previous Owner | Asomani Bob B | $10,000 | |
| Previous Owner | Asomani Bob B | $224,000 |
Source: Public Records
Tax History
| Year | Tax Paid | Tax Assessment Tax Assessment Total Assessment is a certain percentage of the fair market value that is determined by local assessors to be the total taxable value of land and additions on the property. | Land | Improvement |
|---|---|---|---|---|
| 2025 | $5,906 | $425,500 | $88,400 | $337,100 |
| 2024 | $5,791 | $425,500 | $88,400 | $337,100 |
| 2023 | $5,659 | $299,400 | $61,000 | $238,400 |
| 2022 | $5,542 | $299,400 | $61,000 | $238,400 |
| 2021 | $5,389 | $299,400 | $61,000 | $238,400 |
| 2020 | $5,336 | $256,900 | $47,400 | $209,500 |
| 2019 | $5,336 | $256,900 | $47,400 | $209,500 |
| 2018 | $5,213 | $256,900 | $47,400 | $209,500 |
| 2017 | $5,221 | $227,600 | $37,300 | $190,300 |
| 2016 | $5,110 | $227,600 | $37,300 | $190,300 |
| 2015 | $5,110 | $227,600 | $37,300 | $190,300 |
| 2014 | $4,936 | $216,100 | $37,300 | $178,800 |
Source: Public Records
Map
Nearby Homes
- 62 Browne St
- 95 Elwyn St
- 30 Lark Ave
- 51 Old Oak Ave
- 0 Princess Ave
- 79 Chestnut Hill Ave
- 19 Pavilion Ct
- 92 Old Oak Ave
- 151 Chestnut Hill Ave
- 293 Webster Ave
- 46 Hopewell Ave
- 27 What Cheer Ave
- 161 Prudence Ave
- 41 Terrace Ave
- 1250 Cranston St
- 11 Hillhurst Ave
- 74 Lake St Unit 76
- 79 Priscilla Ave
- 27 Moorefield St
- 2 Gansett Ave
Your Personal Tour Guide
Ask me questions while you tour the home.