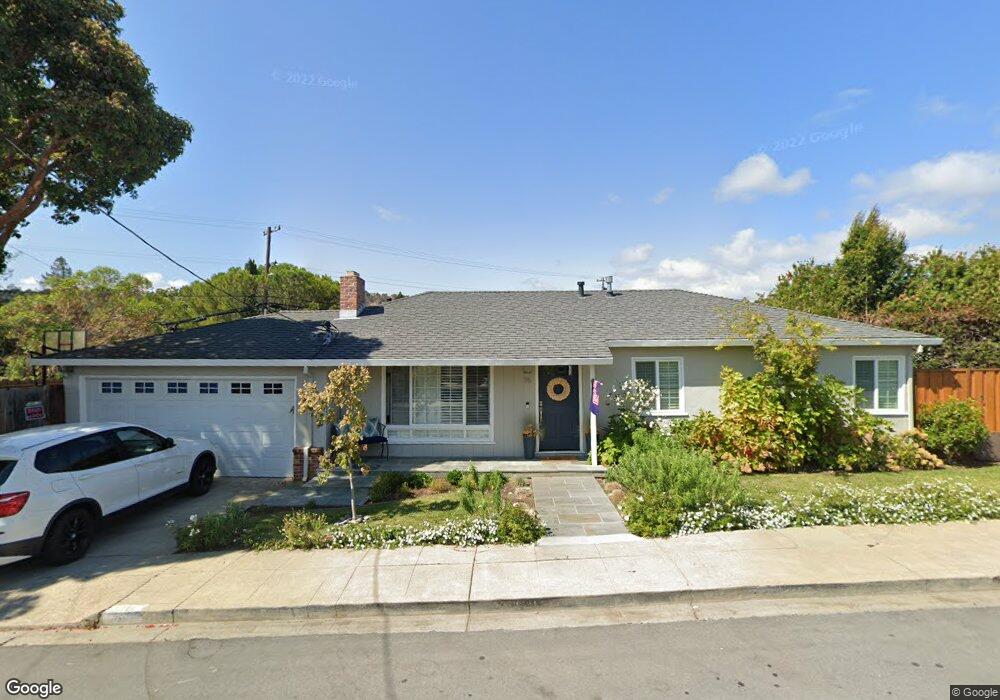
96 Hilltop Dr San Carlos, CA 94070
El Sereno Corte NeighborhoodEstimated Value: $1,955,739 - $2,174,000
3
Beds
2
Baths
1,298
Sq Ft
$1,570/Sq Ft
Est. Value
About This Home
This home is located at 96 Hilltop Dr, San Carlos, CA 94070 and is currently estimated at $2,037,685, approximately $1,569 per square foot. 96 Hilltop Dr is a home located in San Mateo County with nearby schools including Brittan Acres Elementary School, Central Middle School, and Sequoia High School.
Ownership History
Date
Name
Owned For
Owner Type
Purchase Details
Closed on
Jun 12, 2024
Sold by
Robinson Stephen and Robinson Suzanne
Bought by
Robinson Family Trust and Robinson
Current Estimated Value
Purchase Details
Closed on
Feb 25, 2002
Sold by
Casey Desmond Mcconnell and Casey Mitzie Lily
Bought by
Robinson Stephen and Robinson Suzanne
Home Financials for this Owner
Home Financials are based on the most recent Mortgage that was taken out on this home.
Original Mortgage
$424,000
Interest Rate
6.37%
Purchase Details
Closed on
Aug 10, 2001
Sold by
Casey Desmond M and Casey Mitzie L
Bought by
Casey Desmond Mcconnell and Casey Mitzie Lily
Purchase Details
Closed on
Dec 15, 1999
Sold by
Casey Desmond and Casey Mitzie
Bought by
Casey Desmond Mcconnell and Casey Mitzie Lily
Create a Home Valuation Report for This Property
The Home Valuation Report is an in-depth analysis detailing your home's value as well as a comparison with similar homes in the area
Home Values in the Area
Average Home Value in this Area
Purchase History
| Date | Buyer | Sale Price | Title Company |
|---|---|---|---|
| Robinson Family Trust | -- | None Listed On Document | |
| Robinson Stephen | $530,000 | Financial Title Company | |
| Casey Desmond Mcconnell | -- | -- | |
| Casey Desmond Mcconnell | -- | -- |
Source: Public Records
Mortgage History
| Date | Status | Borrower | Loan Amount |
|---|---|---|---|
| Previous Owner | Robinson Stephen | $424,000 | |
| Closed | Robinson Stephen | $52,950 |
Source: Public Records
Tax History Compared to Growth
Tax History
| Year | Tax Paid | Tax Assessment Tax Assessment Total Assessment is a certain percentage of the fair market value that is determined by local assessors to be the total taxable value of land and additions on the property. | Land | Improvement |
|---|---|---|---|---|
| 2025 | $10,949 | $830,221 | $391,473 | $438,748 |
| 2023 | $10,949 | $797,987 | $376,273 | $421,714 |
| 2022 | $10,321 | $782,342 | $368,896 | $413,446 |
| 2021 | $10,164 | $767,003 | $361,663 | $405,340 |
| 2020 | $10,040 | $759,140 | $357,955 | $401,185 |
| 2019 | $9,829 | $744,257 | $350,937 | $393,320 |
| 2018 | $9,566 | $729,664 | $344,056 | $385,608 |
| 2017 | $9,430 | $715,358 | $337,310 | $378,048 |
| 2016 | $9,222 | $701,334 | $330,697 | $370,637 |
| 2015 | $9,190 | $690,801 | $325,730 | $365,071 |
| 2014 | $8,890 | $677,271 | $319,350 | $357,921 |
Source: Public Records
Map
Nearby Homes