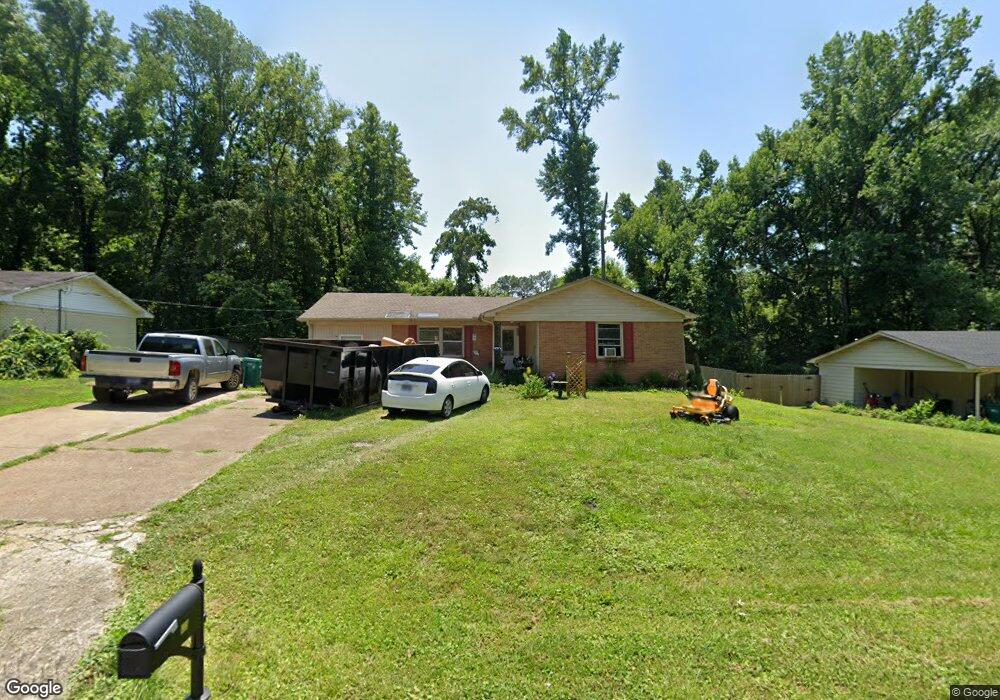
96 Mccool Dr Jackson, TN 38305
Estimated Value: $136,000 - $169,000
Studio
2
Baths
1,440
Sq Ft
$103/Sq Ft
Est. Value
About This Home
This home is located at 96 Mccool Dr, Jackson, TN 38305 and is currently estimated at $147,833, approximately $102 per square foot. 96 Mccool Dr is a home located in Madison County with nearby schools including Thelma Barker Elementary School, Northeast Middle School, and North Side High School.
Ownership History
Date
Name
Owned For
Owner Type
Purchase Details
Closed on
Oct 5, 2011
Sold by
Merit Management Llc
Bought by
Bennett Jonathan P
Current Estimated Value
Purchase Details
Closed on
Feb 28, 2006
Sold by
Sec Of Hud
Bought by
Merit Management Llc
Home Financials for this Owner
Home Financials are based on the most recent Mortgage that was taken out on this home.
Original Mortgage
$64,590
Interest Rate
6.05%
Purchase Details
Closed on
Dec 15, 2005
Sold by
Griffin Denise Sub Tr
Bought by
Sec Of Hud
Purchase Details
Closed on
Dec 8, 2005
Bought by
Secretary Of Housing
Purchase Details
Closed on
May 4, 1994
Sold by
Rayburn Huey
Bought by
Reaves James L
Purchase Details
Closed on
Jul 31, 1990
Bought by
Huey Rayburn
Purchase Details
Closed on
Mar 28, 1980
Bought by
Carson John B
Purchase Details
Closed on
Aug 2, 1976
Purchase Details
Closed on
Jul 14, 1975
Purchase Details
Closed on
Apr 7, 1972
Create a Home Valuation Report for This Property
The Home Valuation Report is an in-depth analysis detailing your home's value as well as a comparison with similar homes in the area
Purchase History
| Date | Buyer | Sale Price | Title Company |
|---|---|---|---|
| Bennett Jonathan P | $65,000 | -- | |
| Merit Management Llc | $51,410 | -- | |
| Sec Of Hud | -- | -- | |
| Secretary Of Housing | -- | -- | |
| Reaves James L | $55,500 | -- | |
| Huey Rayburn | $49,700 | -- | |
| Carson John B | -- | -- | |
| -- | -- | -- | |
| -- | -- | -- | |
| -- | -- | -- |
Source: Public Records
Mortgage History
| Date | Status | Borrower | Loan Amount |
|---|---|---|---|
| Previous Owner | Not Available | $64,590 |
Source: Public Records
Tax History
| Year | Tax Paid | Tax Assessment Tax Assessment Total Assessment is a certain percentage of the fair market value that is determined by local assessors to be the total taxable value of land and additions on the property. | Land | Improvement |
|---|---|---|---|---|
| 2025 | $498 | $26,600 | $3,125 | $23,475 |
| 2024 | $498 | $26,600 | $3,125 | $23,475 |
| 2022 | $927 | $26,600 | $3,125 | $23,475 |
| 2021 | $664 | $15,400 | $1,750 | $13,650 |
| 2020 | $664 | $15,400 | $1,750 | $13,650 |
| 2019 | $664 | $15,400 | $1,750 | $13,650 |
| 2018 | $664 | $15,400 | $1,750 | $13,650 |
| 2017 | $666 | $15,100 | $1,750 | $13,350 |
| 2016 | $621 | $15,100 | $1,750 | $13,350 |
| 2015 | $621 | $15,100 | $1,750 | $13,350 |
| 2014 | $621 | $15,100 | $1,750 | $13,350 |
Source: Public Records
Map
Nearby Homes
- 205 Holiday Dr
- 51 Kemmons Dr
- 116 O'Hara Ln
- 49 Primrose Dr
- 14 Winfield Place
- 24 Seventeen Green
- 116 Chickering Rd
- 222 Country Club Ln
- 114 Country Club Ln
- 48 Sunhaven Dr
- 260 Stonehaven Cove
- 12 Brookstone Place
- 160 Plantation Rd
- 0 Tract 1 U S 45
- 139 Windemere Cir
- 7 Robinhood Ln
- 258 Old Humboldt Rd
- 75 Old Humboldt Rd
- 45 Countrywood Dr
- 68 Windemere Cir
Your Personal Tour Guide
Ask me questions while you tour the home.