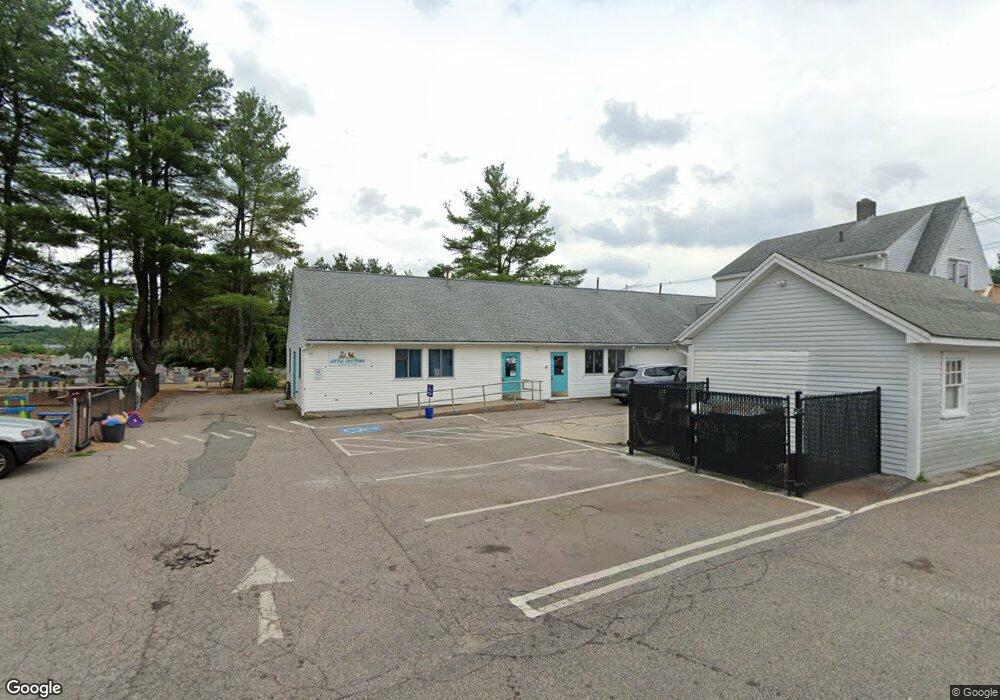
96 Medway Rd Milford, MA 01757
Estimated Value: $608,348
--
Bed
1
Bath
4,107
Sq Ft
$148/Sq Ft
Est. Value
About This Home
This home is located at 96 Medway Rd, Milford, MA 01757 and is currently estimated at $608,348, approximately $148 per square foot. 96 Medway Rd is a home located in Worcester County with nearby schools including Milford High School.
Ownership History
Date
Name
Owned For
Owner Type
Purchase Details
Closed on
Jul 25, 2023
Sold by
Lttle Critters Daycare
Bought by
Mgm Nt and Morais
Current Estimated Value
Purchase Details
Closed on
Apr 27, 2015
Sold by
Fomitcheva Elena V and Trishin Michael P
Bought by
96 Medway Road Co
Purchase Details
Closed on
Aug 26, 2014
Sold by
Beyer Barbara A and Bayview Loan Svcing Ll
Bought by
Bayview Loan Svcing Ll
Purchase Details
Closed on
Jul 6, 1989
Sold by
Mazzarelli Marie
Bought by
96 Medway Rd Rt
Home Financials for this Owner
Home Financials are based on the most recent Mortgage that was taken out on this home.
Original Mortgage
$325,000
Interest Rate
10.38%
Mortgage Type
Commercial
Create a Home Valuation Report for This Property
The Home Valuation Report is an in-depth analysis detailing your home's value as well as a comparison with similar homes in the area
Home Values in the Area
Average Home Value in this Area
Purchase History
| Date | Buyer | Sale Price | Title Company |
|---|---|---|---|
| Mgm Nt | -- | None Available | |
| 96 Medway Road Co | -- | -- | |
| Bayview Loan Svcing Ll | $199,500 | -- | |
| 96 Medway Rd Rt | $162,000 | -- |
Source: Public Records
Mortgage History
| Date | Status | Borrower | Loan Amount |
|---|---|---|---|
| Previous Owner | 96 Medway Rd Rt | $325,000 |
Source: Public Records
Tax History Compared to Growth
Tax History
| Year | Tax Paid | Tax Assessment Tax Assessment Total Assessment is a certain percentage of the fair market value that is determined by local assessors to be the total taxable value of land and additions on the property. | Land | Improvement |
|---|---|---|---|---|
| 2025 | $5,997 | $468,500 | $190,700 | $277,800 |
| 2024 | $6,014 | $452,500 | $183,100 | $269,400 |
| 2023 | $5,819 | $402,700 | $152,600 | $250,100 |
| 2022 | $5,724 | $371,900 | $141,100 | $230,800 |
| 2021 | $4,944 | $309,400 | $141,100 | $168,300 |
| 2020 | $9,224 | $303,100 | $141,100 | $162,000 |
| 2019 | $9,224 | $298,700 | $141,100 | $157,600 |
| 2018 | $9,101 | $293,000 | $135,400 | $157,600 |
| 2017 | $8,913 | $293,000 | $135,400 | $157,600 |
| 2016 | $4,793 | $279,000 | $135,400 | $143,600 |
| 2015 | $4,796 | $273,300 | $129,700 | $143,600 |
Source: Public Records
Map
Nearby Homes
- 4 E Charles St
- 35 Woodland Ave Unit 35A
- 15 Free St
- Lot 1 Florence St
- 17 Middleton St
- 9 Hillside Ave
- 33 Brown Bear Ln Unit 33
- 3 S Central St
- 11 Black Bear Unit 11
- 57 Beach St
- 9 Black Bear Cir Unit 9
- 10 Black Bear Unit 10
- 7 Black Bear Unit 7
- 43 Black Bear Cir Unit 43
- 3 Black Bear Cir Unit 3
- 48 Black Bear Cir Unit 48
- 97 E Street Extension
- 55 Jefferson St
- 23 Christina Rd
- 85 Fisher St