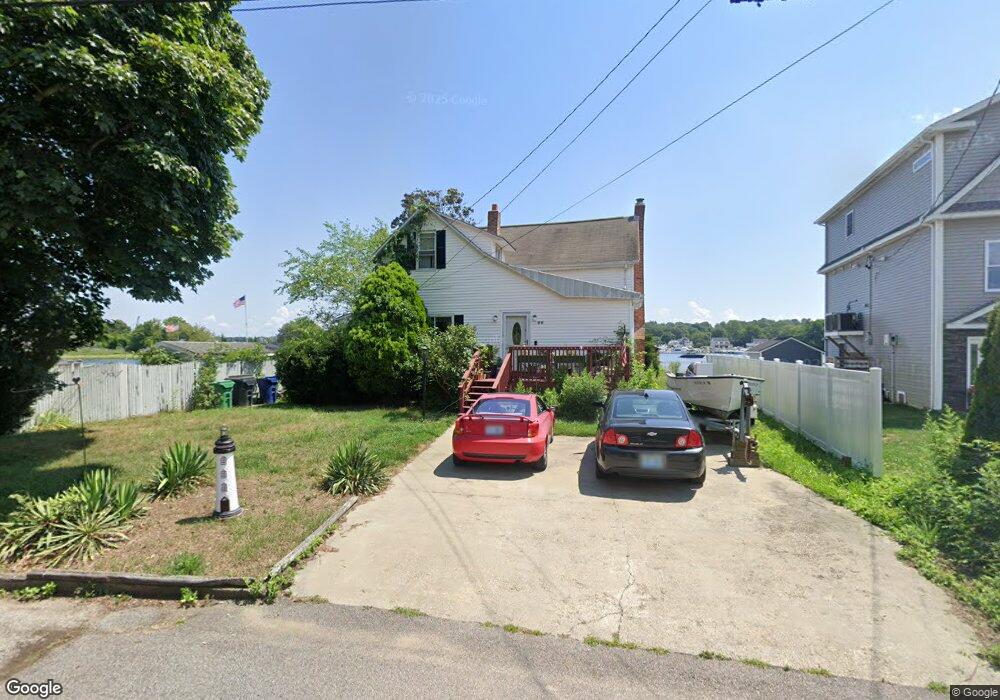
96 Sheffield St Warwick, RI 02889
Oakland Beach NeighborhoodEstimated Value: $460,000 - $573,912
3
Beds
1
Bath
1,733
Sq Ft
$304/Sq Ft
Est. Value
About This Home
This home is located at 96 Sheffield St, Warwick, RI 02889 and is currently estimated at $527,228, approximately $304 per square foot. 96 Sheffield St is a home located in Kent County with nearby schools including Saint Kevin School and Bishop Hendricken High School.
Ownership History
Date
Name
Owned For
Owner Type
Purchase Details
Closed on
Apr 15, 2013
Sold by
Tweedy William T and Silvia Kathleen M
Bought by
Tweedy Joanne R
Current Estimated Value
Purchase Details
Closed on
Sep 8, 2011
Sold by
Tweedy Joanne R
Bought by
Tweedy Wiliam T and Silvia Kathleen M
Create a Home Valuation Report for This Property
The Home Valuation Report is an in-depth analysis detailing your home's value as well as a comparison with similar homes in the area
Home Values in the Area
Average Home Value in this Area
Purchase History
| Date | Buyer | Sale Price | Title Company |
|---|---|---|---|
| Tweedy Joanne R | -- | -- | |
| Tweedy Wiliam T | -- | -- |
Source: Public Records
Mortgage History
| Date | Status | Borrower | Loan Amount |
|---|---|---|---|
| Previous Owner | Tweedy Wiliam T | $68,300 | |
| Previous Owner | Tweedy Wiliam T | $70,000 |
Source: Public Records
Tax History
| Year | Tax Paid | Tax Assessment Tax Assessment Total Assessment is a certain percentage of the fair market value that is determined by local assessors to be the total taxable value of land and additions on the property. | Land | Improvement |
|---|---|---|---|---|
| 2025 | $7,603 | $598,700 | $347,200 | $251,500 |
| 2024 | $7,181 | $496,300 | $302,100 | $194,200 |
| 2023 | $7,042 | $496,300 | $302,100 | $194,200 |
| 2022 | $6,125 | $327,000 | $176,100 | $150,900 |
| 2021 | $6,125 | $327,000 | $176,100 | $150,900 |
| 2020 | $6,125 | $327,000 | $176,100 | $150,900 |
| 2019 | $6,125 | $327,000 | $176,100 | $150,900 |
| 2018 | $5,676 | $272,900 | $176,100 | $96,800 |
| 2017 | $5,523 | $272,900 | $176,100 | $96,800 |
| 2016 | $5,523 | $272,900 | $176,100 | $96,800 |
| 2015 | $5,476 | $263,900 | $152,400 | $111,500 |
| 2014 | $5,294 | $263,900 | $152,400 | $111,500 |
| 2013 | $5,223 | $263,900 | $152,400 | $111,500 |
Source: Public Records
Map
Nearby Homes
- 357 Pequot Ave
- 52 Uncas St
- 83 Ottawa Ave
- 107 Coburn St
- 90 Huron St
- 79 Suburban Pkwy
- 31 Oakhurst Ave
- 75 Northup St
- 73 Pinehurst Ave
- 71 Pinehurst Ave
- 79 Pinehurst Ave
- 81 Pinehurst Ave
- 0 Sea View Dr
- 585 Meadow View Ave
- 188 Wood St
- 30 White Rock Rd
- 43 Beaver Ave
- 0 Meadow View Ave
- 357 Warwick Neck Ave
- 215 Rocky Point Ave
Your Personal Tour Guide
Ask me questions while you tour the home.