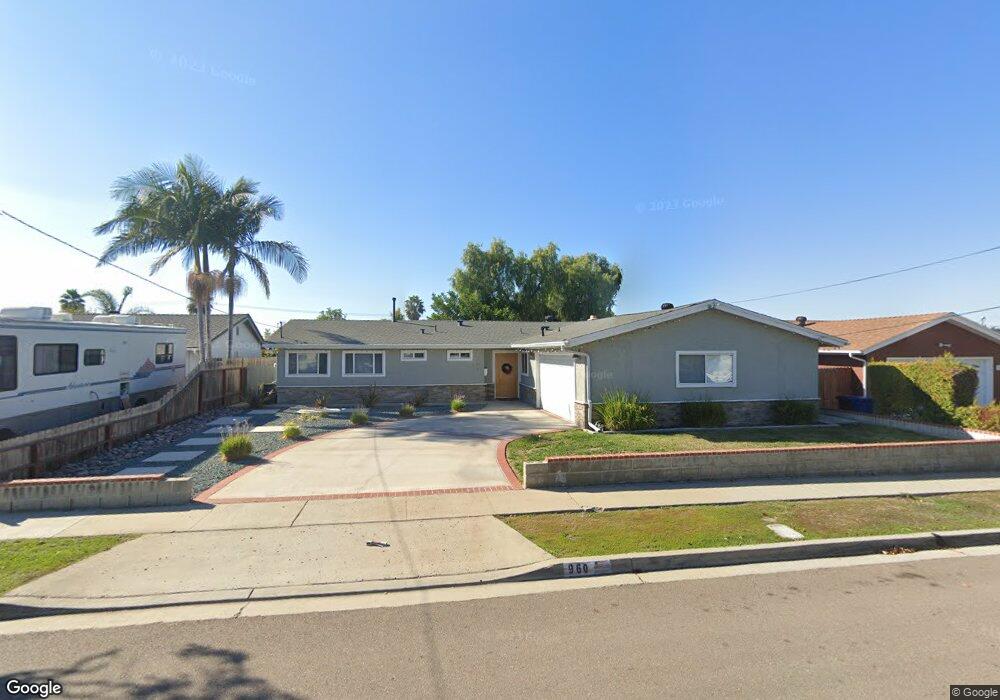
960 Myra Ave Chula Vista, CA 91911
Castle Park NeighborhoodEstimated Value: $800,000 - $866,000
4
Beds
2
Baths
1,539
Sq Ft
$546/Sq Ft
Est. Value
About This Home
This home is located at 960 Myra Ave, Chula Vista, CA 91911 and is currently estimated at $840,035, approximately $545 per square foot. 960 Myra Ave is a home located in San Diego County with nearby schools including Karl H Kellogg Elementary School, Hilltop Middle School, and Hilltop Senior High School.
Ownership History
Date
Name
Owned For
Owner Type
Purchase Details
Closed on
May 27, 2016
Sold by
Czarnowski Robert
Bought by
Zaatari Talaal S and Zaatari Jeannette M
Current Estimated Value
Home Financials for this Owner
Home Financials are based on the most recent Mortgage that was taken out on this home.
Original Mortgage
$388,800
Outstanding Balance
$310,346
Interest Rate
3.66%
Mortgage Type
New Conventional
Estimated Equity
$529,689
Purchase Details
Closed on
Feb 27, 2016
Sold by
Labore Howard
Bought by
Czamowski Robert
Purchase Details
Closed on
Oct 13, 1997
Sold by
Labore Harry G and Labore Helen H
Bought by
Labore Harry and Labore Helen
Purchase Details
Closed on
Oct 3, 1994
Sold by
Labore Harry and Labore Helen
Bought by
Labore Harry G and Labore Helen H
Purchase Details
Closed on
Jun 30, 1994
Sold by
Labore Harry G and Labore Helen H
Bought by
Labore Harry and Labore Helen
Create a Home Valuation Report for This Property
The Home Valuation Report is an in-depth analysis detailing your home's value as well as a comparison with similar homes in the area
Home Values in the Area
Average Home Value in this Area
Purchase History
| Date | Buyer | Sale Price | Title Company |
|---|---|---|---|
| Zaatari Talaal S | $486,000 | Chicago Title Company | |
| Czamowski Robert | $355,000 | Chicago Title Company | |
| Czarnowski Robert | -- | Chicago Title Company | |
| Labore Harry | -- | -- | |
| Labore Harry G | -- | Fidelity National Title | |
| Labore Harry | -- | -- |
Source: Public Records
Mortgage History
| Date | Status | Borrower | Loan Amount |
|---|---|---|---|
| Open | Zaatari Talaal S | $388,800 |
Source: Public Records
Tax History
| Year | Tax Paid | Tax Assessment Tax Assessment Total Assessment is a certain percentage of the fair market value that is determined by local assessors to be the total taxable value of land and additions on the property. | Land | Improvement |
|---|---|---|---|---|
| 2025 | $6,545 | $575,318 | $449,840 | $125,478 |
| 2024 | $6,545 | $564,038 | $441,020 | $123,018 |
| 2023 | $6,455 | $552,979 | $432,373 | $120,606 |
| 2022 | $6,268 | $542,138 | $423,896 | $118,242 |
| 2021 | $6,121 | $531,509 | $415,585 | $115,924 |
| 2020 | $5,974 | $526,060 | $411,324 | $114,736 |
| 2019 | $5,818 | $515,746 | $403,259 | $112,487 |
| 2018 | $5,727 | $505,634 | $395,352 | $110,282 |
| 2017 | $5,606 | $495,720 | $387,600 | $108,120 |
| 2016 | $783 | $73,330 | $18,124 | $55,206 |
| 2015 | $771 | $72,229 | $17,852 | $54,377 |
| 2014 | $758 | $70,815 | $17,503 | $53,312 |
Source: Public Records
Map
Nearby Homes
- 953 Maria Way
- 158 E L St
- 902 Monterey Ct
- 1017 Helix Ave
- 1027 Guatay Ave
- 376 Roman Way
- 232 E Naples St
- 1054 Cuyamaca Ave
- 927 Agua Tibia Ave
- 859 Tamayo Dr Unit 2
- 75 E Naples St
- 814 Tamayo Dr Unit 2
- 202 E J St
- 445 Montcalm St
- 476 Montclair St
- 1267 Melrose Ave
- 838 David Dr
- 1268 Helix Ave
- 112 Country Club Dr
- 586 88 Roosevelt St
Your Personal Tour Guide
Ask me questions while you tour the home.