9601 Cedar Ridge Rd Missoula, MT 59804
Estimated Value: $673,000 - $1,061,000
3
Beds
2
Baths
190
Sq Ft
$4,669/Sq Ft
Est. Value
About This Home
This home is located at 9601 Cedar Ridge Rd, Missoula, MT 59804 and is currently estimated at $887,018, approximately $4,668 per square foot. 9601 Cedar Ridge Rd is a home located in Missoula County with nearby schools including Target Range School and Big Sky High School.
Ownership History
Date
Name
Owned For
Owner Type
Purchase Details
Closed on
Aug 4, 2016
Sold by
Seninger Stephen F and Herling Daphne L
Bought by
Seninger Stephen F and Herling Daphne L
Current Estimated Value
Purchase Details
Closed on
Jun 21, 2007
Sold by
Folley Connor T
Bought by
Seninger Stephen F and Herling Daphne
Home Financials for this Owner
Home Financials are based on the most recent Mortgage that was taken out on this home.
Original Mortgage
$150,000
Outstanding Balance
$91,635
Interest Rate
6.16%
Mortgage Type
Unknown
Estimated Equity
$795,383
Purchase Details
Closed on
Dec 15, 2004
Sold by
Sisler Matthew J and Sisler Julie A
Bought by
Folley Connor T
Home Financials for this Owner
Home Financials are based on the most recent Mortgage that was taken out on this home.
Original Mortgage
$247,200
Interest Rate
4.75%
Mortgage Type
Unknown
Create a Home Valuation Report for This Property
The Home Valuation Report is an in-depth analysis detailing your home's value as well as a comparison with similar homes in the area
Home Values in the Area
Average Home Value in this Area
Purchase History
| Date | Buyer | Sale Price | Title Company |
|---|---|---|---|
| Seninger Stephen F | -- | None Available | |
| Seninger Stephen F | -- | Insured Titles Llc | |
| Folley Connor T | -- | -- |
Source: Public Records
Mortgage History
| Date | Status | Borrower | Loan Amount |
|---|---|---|---|
| Open | Seninger Stephen F | $150,000 | |
| Previous Owner | Folley Connor T | $247,200 | |
| Closed | Folley Connor T | $30,900 |
Source: Public Records
Tax History Compared to Growth
Tax History
| Year | Tax Paid | Tax Assessment Tax Assessment Total Assessment is a certain percentage of the fair market value that is determined by local assessors to be the total taxable value of land and additions on the property. | Land | Improvement |
|---|---|---|---|---|
| 2025 | $5,139 | $728,600 | $284,570 | $444,030 |
| 2024 | $5,512 | $572,100 | $222,776 | $349,324 |
| 2023 | $4,985 | $572,100 | $222,776 | $349,324 |
| 2022 | $4,221 | $425,100 | $0 | $0 |
| 2021 | $4,076 | $425,100 | $0 | $0 |
| 2020 | $3,672 | $370,800 | $0 | $0 |
| 2019 | $3,645 | $370,800 | $0 | $0 |
| 2018 | $3,373 | $350,332 | $0 | $0 |
| 2017 | $3,379 | $350,332 | $0 | $0 |
| 2016 | $3,561 | $371,145 | $0 | $0 |
| 2015 | $3,434 | $371,145 | $0 | $0 |
| 2014 | $3,352 | $198,856 | $0 | $0 |
Source: Public Records
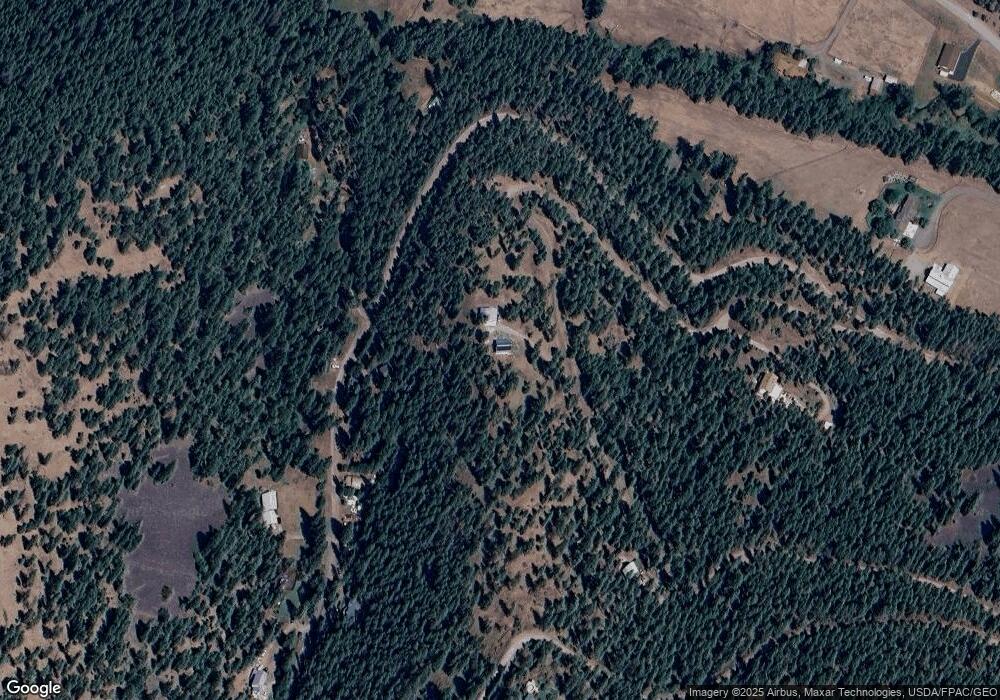
Map
Nearby Homes
- 9995 O Brien Creek Rd
- 2700 Lyon Creek Rd
- 2705 Lyon Creek Rd
- 325 Big Flat Rd
- 296 Big Flat Rd
- 11775 Horseback Ridge Rd
- 2201 Rafferty Ln
- 1211 Kenwood Dr
- 3101 Humble Rd
- 1085 Spurgin Ct
- 4316 North Ave W
- 2222 Pauline Dr
- 3720 Sierra Dr
- NHN Haven Heights Rd
- 7950 Toby Way
- Nhn 40th Ave
- 1935 Oriole Dr
- 1522 Clements Rd
- 10227 Pale Morning Ct
- 10223 Pale Morning Ct Unit 20t
- 2349 Lyon Creek Rd
- 2350 Lyon Creek Rd
- 2425 Lyon Creek Rd
- 2220 Lyon Creek Rd
- 2230 Lyon Creek Rd
- 9625 Cedar Ridge Rd
- 9494 Cedar Ridge Rd
- 2450 Lyon Creek Rd
- 9825 Cedar Ridge Rd
- 2578 Lyon Creek Rd
- 2250 Lyon Creek Rd
- 10475 Cedar Ridge Rd
- NHN Lyon Creek Rd
- 10025 Obrien Creek Rd
- 2620 Lyon Creek Rd
- 9995 Obrien Creek Rd
- Tract 14 Cedar Ridge Rd
- NHN Cedar Ridge Rd
- 10355 Obrien Creek Rd
- 10511 Cedar Ridge Rd