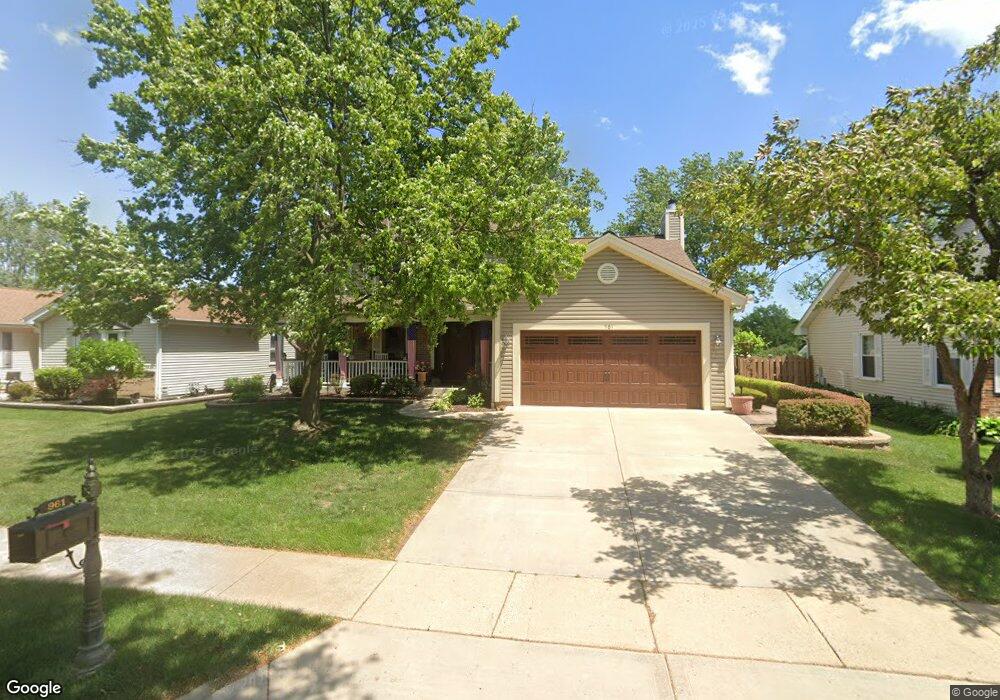
961 Pear Tree Ln Wheeling, IL 60090
Estimated Value: $498,346 - $543,000
4
Beds
3
Baths
2,229
Sq Ft
$234/Sq Ft
Est. Value
About This Home
This home is located at 961 Pear Tree Ln, Wheeling, IL 60090 and is currently estimated at $521,337, approximately $233 per square foot. 961 Pear Tree Ln is a home located in Cook County with nearby schools including Dwight D Eisenhower Elementary School, Bonfield Grade School, and Anne Sullivan Elementary School.
Ownership History
Date
Name
Owned For
Owner Type
Purchase Details
Closed on
Oct 19, 2004
Sold by
Cheng Fred and Quach Chi
Bought by
Yacu Christopher A and Yacu Maha H
Current Estimated Value
Home Financials for this Owner
Home Financials are based on the most recent Mortgage that was taken out on this home.
Original Mortgage
$270,000
Outstanding Balance
$131,291
Interest Rate
5.5%
Mortgage Type
Unknown
Estimated Equity
$390,046
Purchase Details
Closed on
Jun 29, 1995
Sold by
Fyock John J and Fyock Cheri B
Bought by
Cheng Fred and Quach Chi
Home Financials for this Owner
Home Financials are based on the most recent Mortgage that was taken out on this home.
Original Mortgage
$192,600
Interest Rate
7.9%
Create a Home Valuation Report for This Property
The Home Valuation Report is an in-depth analysis detailing your home's value as well as a comparison with similar homes in the area
Home Values in the Area
Average Home Value in this Area
Purchase History
| Date | Buyer | Sale Price | Title Company |
|---|---|---|---|
| Yacu Christopher A | $415,000 | Pntn | |
| Cheng Fred | $241,000 | -- |
Source: Public Records
Mortgage History
| Date | Status | Borrower | Loan Amount |
|---|---|---|---|
| Open | Yacu Christopher A | $270,000 | |
| Previous Owner | Cheng Fred | $192,600 |
Source: Public Records
Tax History Compared to Growth
Tax History
| Year | Tax Paid | Tax Assessment Tax Assessment Total Assessment is a certain percentage of the fair market value that is determined by local assessors to be the total taxable value of land and additions on the property. | Land | Improvement |
|---|---|---|---|---|
| 2024 | $8,099 | $30,556 | $7,508 | $23,048 |
| 2023 | $7,707 | $30,556 | $7,508 | $23,048 |
| 2022 | $7,707 | $30,556 | $7,508 | $23,048 |
| 2021 | $8,200 | $28,092 | $5,118 | $22,974 |
| 2020 | $8,052 | $28,092 | $5,118 | $22,974 |
| 2019 | $8,091 | $31,353 | $5,118 | $26,235 |
| 2018 | $7,591 | $27,283 | $4,436 | $22,847 |
| 2017 | $7,501 | $27,283 | $4,436 | $22,847 |
| 2016 | $7,232 | $27,283 | $4,436 | $22,847 |
| 2015 | $8,108 | $28,242 | $3,924 | $24,318 |
| 2014 | $7,916 | $28,242 | $3,924 | $24,318 |
| 2013 | $10,786 | $38,672 | $3,924 | $34,748 |
Source: Public Records
Map
Nearby Homes
- 1088 Pear Tree Ln
- 940 Tanglewood Dr
- 1321 Longacre Ln Unit 45
- 1201 Pleasant Run Dr Unit 312
- 1111 Pleasant Run Dr Unit 911
- 1376 Longacre Ln Unit 113
- 200 Violet Ln
- 1033 Wheeling Rd
- 1425 Sandpebble Dr Unit 227
- 1425 Sandpebble Dr Unit 340
- 1014 N Elmhurst Rd
- 1430 Sandstone Dr Unit 202
- 1450 Sandpebble Dr Unit 333
- 1450 Sandpebble Dr Unit 227
- 701 Garth Rd
- 1049 Peace Dr
- 10 N Wildwood Dr
- 1525 Sander Ct Unit 103
- 1575 Sandpebble Dr Unit 113
- 17 N Wildwood Dr
- 951 Pear Tree Ln Unit 2
- 971 Pear Tree Ln
- 941 Pear Tree Ln
- 972 Pear Tree Ln
- 962 Pear Tree Ln
- 982 Pear Tree Ln
- 952 Pear Tree Ln
- 931 Pear Tree Ln
- 991 Pear Tree Ln
- 992 Pear Tree Ln
- 942 Pear Tree Ln
- 1003 Shady Tree Ln Unit 2
- 921 Pear Tree Ln
- 1002 Pear Tree Ln
- 993 Shady Tree Ln
- 1001 Pear Tree Ln
- 1013 Shady Tree Ln
- 932 Pear Tree Ln
- 1023 Shady Tree Ln
- 983 Shady Tree Ln