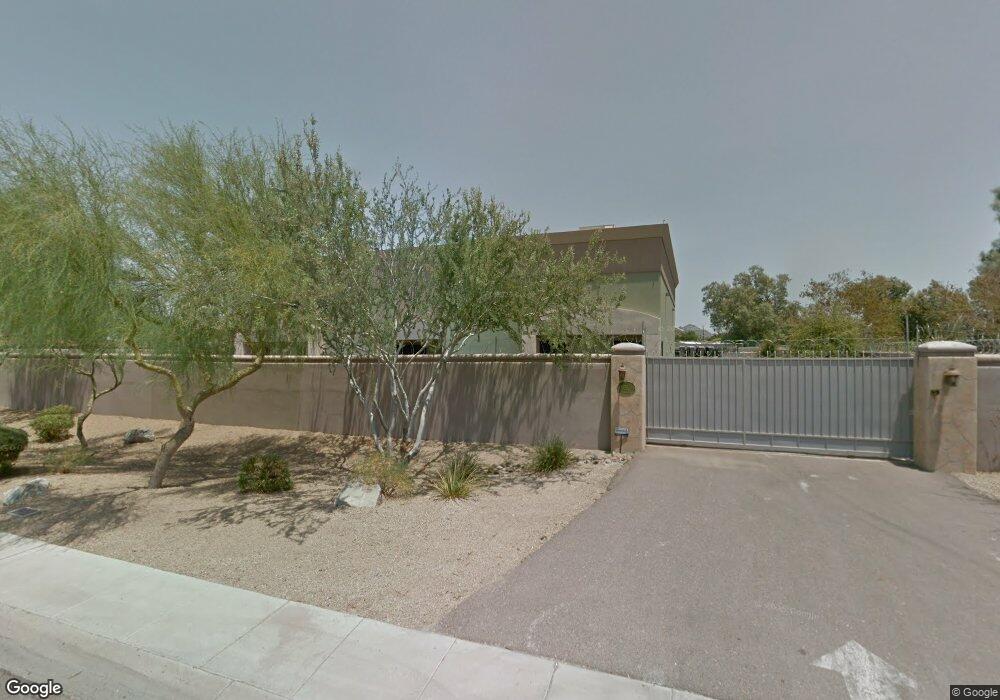
9611 N 16th Ave Unit 1 Phoenix, AZ 85021
North Mountain Village Neighborhood
--
Bed
1
Bath
10,472
Sq Ft
0.81
Acres
About This Home
This home is located at 9611 N 16th Ave Unit 1, Phoenix, AZ 85021. 9611 N 16th Ave Unit 1 is a home located in Maricopa County with nearby schools including Mountain View Elementary School, Sunnyslope High School, and Bennett Academy – Venture Site.
Ownership History
Date
Name
Owned For
Owner Type
Purchase Details
Closed on
Feb 3, 2011
Sold by
Nuco Plastering & Stucco Inc
Bought by
The Carioca Company
Purchase Details
Closed on
May 24, 2005
Sold by
Nuco Plastering & Stucco Inc
Bought by
Nuco Plastering & Stucco Inc
Home Financials for this Owner
Home Financials are based on the most recent Mortgage that was taken out on this home.
Original Mortgage
$539,000
Interest Rate
5.84%
Mortgage Type
Commercial
Purchase Details
Closed on
Jul 19, 2000
Sold by
Doerr Christian T
Bought by
Nuco Plastering Inc
Home Financials for this Owner
Home Financials are based on the most recent Mortgage that was taken out on this home.
Original Mortgage
$30,000
Interest Rate
8.37%
Mortgage Type
Seller Take Back
Create a Home Valuation Report for This Property
The Home Valuation Report is an in-depth analysis detailing your home's value as well as a comparison with similar homes in the area
Home Values in the Area
Average Home Value in this Area
Purchase History
| Date | Buyer | Sale Price | Title Company |
|---|---|---|---|
| The Carioca Company | $550,000 | Chicago Title | |
| Nuco Plastering & Stucco Inc | -- | Great American Title Agency | |
| Nuco Plastering Inc | $8,320 | First American Title | |
| Nuco Plastering Inc | $50,000 | First American Title | |
| Doerr Christian T | -- | First American Title |
Source: Public Records
Mortgage History
| Date | Status | Borrower | Loan Amount |
|---|---|---|---|
| Previous Owner | Nuco Plastering & Stucco Inc | $539,000 | |
| Previous Owner | Nuco Plastering Inc | $30,000 |
Source: Public Records
Tax History Compared to Growth
Tax History
| Year | Tax Paid | Tax Assessment Tax Assessment Total Assessment is a certain percentage of the fair market value that is determined by local assessors to be the total taxable value of land and additions on the property. | Land | Improvement |
|---|---|---|---|---|
| 2025 | $17,701 | $139,290 | -- | -- |
| 2024 | $17,772 | $136,803 | -- | -- |
| 2023 | $17,772 | $183,923 | $41,752 | $142,171 |
| 2022 | $17,698 | $167,581 | $35,473 | $132,108 |
| 2021 | $18,438 | $192,492 | $36,486 | $156,006 |
| 2020 | $17,977 | $198,054 | $33,750 | $164,304 |
| 2019 | $17,649 | $177,480 | $30,402 | $147,078 |
| 2018 | $17,187 | $182,646 | $30,042 | $152,604 |
| 2017 | $17,100 | $180,666 | $28,890 | $151,776 |
| 2016 | $16,789 | $148,482 | $25,272 | $123,210 |
| 2015 | $15,980 | $128,372 | $23,033 | $105,339 |
Source: Public Records
Map
Nearby Homes
- 1644 W Mountain View Rd
- 9845 N 15th Ave
- 1702 W Hatcher Rd
- 10012 N 16th Dr
- 9827 N 17th Dr
- 1802 W Vogel Ave
- 10202 N 15th Ave Unit 2
- 1111 W Cinnabar Ave
- 1723 W Cheryl Dr
- 1326 W Cheryl Dr
- 9628 N 10th Ave
- 10014 N 18th Ave
- 9022 N 18th Dr
- 1526 W North Ln
- 10258 N 18th Ave
- 2050 W Dunlap Ave Unit C070
- 2050 W Dunlap Ave Unit F294
- 2050 W Dunlap Ave Unit K310
- 2050 W Dunlap Ave Unit E227
- 2050 W Dunlap Ave Unit C106
- 9621 N 16th Ave
- 9601 N 16th Ave
- 9637 N 16th Ave
- 9624 N 16th Ave Unit 16
- 9624 N 16th Ave Unit B
- 9624 N 16th Ave Unit A
- 9624 N 16th Ave
- 1595 W Mountain View Rd Unit 6
- 1595 W Mountain View Rd Unit 8
- 1595 W Mountain View Rd Unit 10
- 1595 W Mountain View Rd Unit 11
- 1595 W Mountain View Rd
- 1595 W Mountain View Rd Unit 12
- 1595 W Mountain View Rd Unit 2
- 1595 W Mountain View Rd Unit 3
- 1595 W Mountain View Rd Unit 9
- 1595 W Mountain View Rd Unit 1
- 1595 W Mountain View Rd Unit 4
- 9610 N 16th Ave Unit 1
- 9610 N 16th Ave