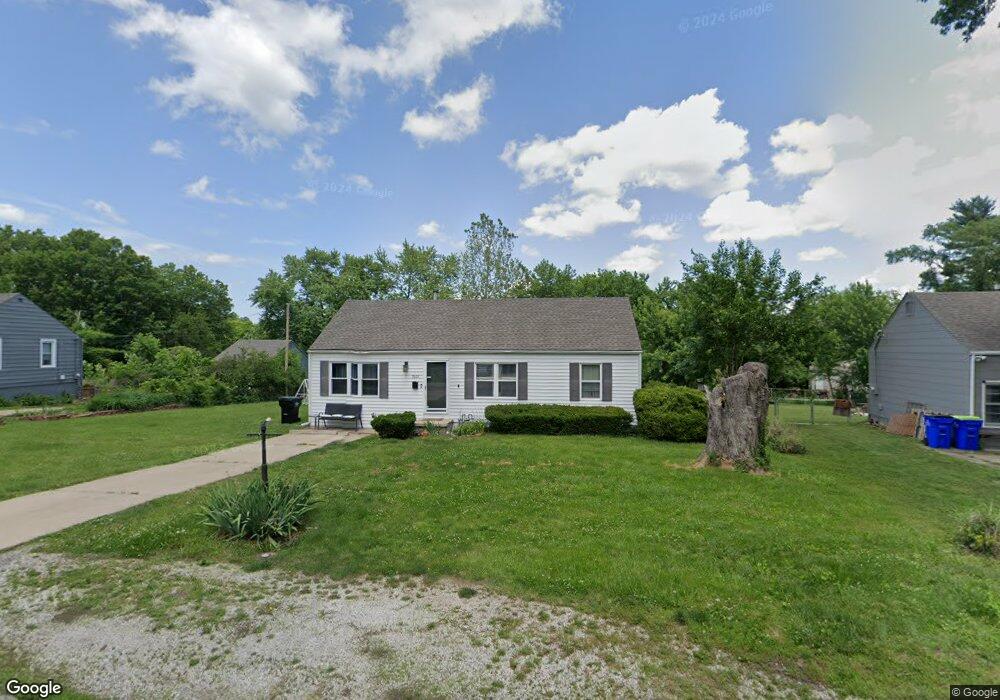
9612 E 68th St Raytown, MO 64133
Estimated Value: $150,410 - $184,000
2
Beds
1
Bath
984
Sq Ft
$169/Sq Ft
Est. Value
About This Home
This home is located at 9612 E 68th St, Raytown, MO 64133 and is currently estimated at $166,603, approximately $169 per square foot. 9612 E 68th St is a home located in Jackson County with nearby schools including Blue Ridge Elementary School and Raytown Central Middle School.
Ownership History
Date
Name
Owned For
Owner Type
Purchase Details
Closed on
Oct 22, 2021
Sold by
Melson Mark W and Melson Kerri J
Bought by
Messenger Julie K
Current Estimated Value
Home Financials for this Owner
Home Financials are based on the most recent Mortgage that was taken out on this home.
Original Mortgage
$103,098
Outstanding Balance
$94,016
Interest Rate
2.8%
Mortgage Type
FHA
Estimated Equity
$72,587
Purchase Details
Closed on
May 18, 2020
Sold by
Freeman Loran and Freeman Christine L
Bought by
Melson Mark W
Purchase Details
Closed on
Apr 29, 2002
Sold by
Mallon George H and Mallon Susanna C
Bought by
Freeman Loran F and Freeman Keli R
Home Financials for this Owner
Home Financials are based on the most recent Mortgage that was taken out on this home.
Original Mortgage
$73,841
Interest Rate
7.11%
Mortgage Type
FHA
Create a Home Valuation Report for This Property
The Home Valuation Report is an in-depth analysis detailing your home's value as well as a comparison with similar homes in the area
Home Values in the Area
Average Home Value in this Area
Purchase History
| Date | Buyer | Sale Price | Title Company |
|---|---|---|---|
| Messenger Julie K | -- | Coffelt Land Title Inc | |
| Melson Mark W | -- | None Available | |
| Freeman Loran F | -- | Ati Title Company |
Source: Public Records
Mortgage History
| Date | Status | Borrower | Loan Amount |
|---|---|---|---|
| Open | Messenger Julie K | $103,098 | |
| Previous Owner | Freeman Loran F | $73,841 |
Source: Public Records
Tax History
| Year | Tax Paid | Tax Assessment Tax Assessment Total Assessment is a certain percentage of the fair market value that is determined by local assessors to be the total taxable value of land and additions on the property. | Land | Improvement |
|---|---|---|---|---|
| 2025 | $1,946 | $13,568 | $3,709 | $9,859 |
| 2024 | $1,933 | $21,571 | $5,672 | $15,899 |
| 2023 | $1,933 | $21,571 | $3,411 | $18,160 |
| 2022 | $965 | $10,260 | $4,655 | $5,605 |
| 2021 | $968 | $10,260 | $4,655 | $5,605 |
| 2020 | $1,093 | $11,465 | $4,655 | $6,810 |
| 2019 | $1,087 | $11,465 | $4,655 | $6,810 |
| 2018 | $957 | $10,458 | $2,753 | $7,705 |
| 2016 | $928 | $10,196 | $3,327 | $6,869 |
Source: Public Records
Map
Nearby Homes
- 9609 E 68th St
- 9804 E 68 St
- 9616 E 66th St
- 10019 E 67th St
- 10027 E 67th St
- 9314 E 68th Terrace
- 10005 E 69th Terrace
- 7005 Raytown Rd
- 9705 E Gregory Blvd
- 10201 E 70th Terrace
- 6824 Laurel Ave
- 6517 Hardy Ave
- 9416 E 64th St
- 6828 Lakeshore Dr
- 10208 E 71st Terrace
- 6310 Raytown Rd
- 6817 Lakeshore Dr
- 8500 E State Route 350
- 9202 E 64th Terrace
- 7101 Willow Ave
- 9700 E 68th St
- 9708 Plymouth Ln
- 9604 E 68th St
- 9613 E 67th Terrace
- 9701 E 67th Terrace
- 9613 E 68th St
- 9609 E 67th Terrace
- 9701 E 68th Terrace
- 9701 E 68th Terrace
- 9605 E 68th St
- 9600 E 68th St
- 9705 Plymouth Ln
- 9704 E 68th St
- 9705 E 67th Terrace
- 9605 E 67th Terrace
- 9712 Plymouth Ln
- 9703 E 68th Terrace
- 9601 E 68th St
- 9709 Plymouth Ln
- 9708 E 68 St
Your Personal Tour Guide
Ask me questions while you tour the home.