Estimated Value: $229,000 - $331,692
2
Beds
1
Bath
1,014
Sq Ft
$281/Sq Ft
Est. Value
About This Home
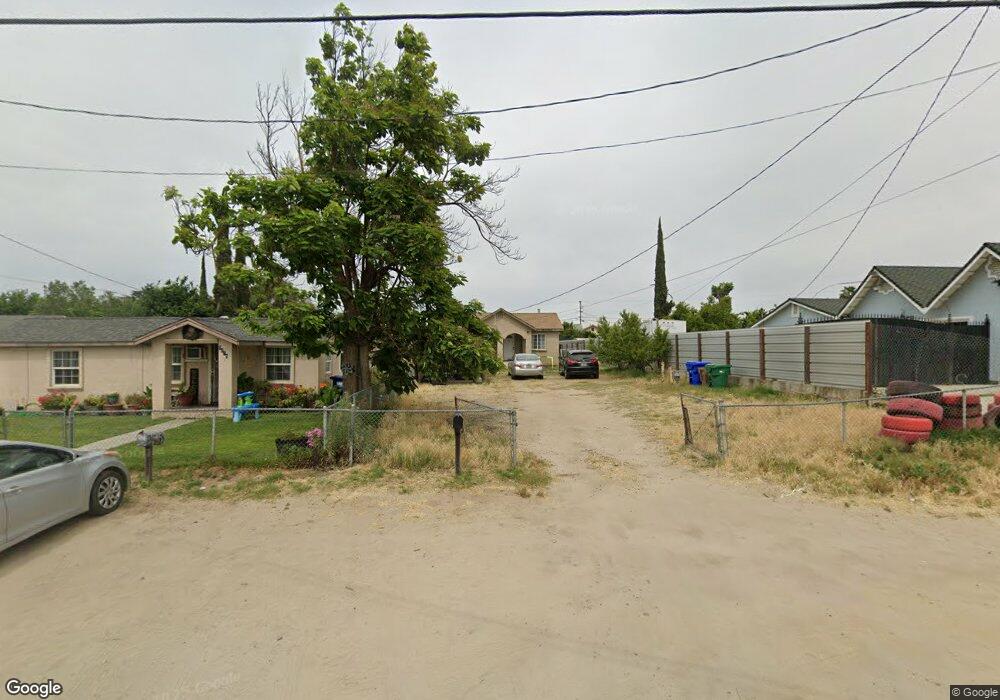
This home is located at 9612 Hinton Ave, Delhi, CA 95315 and is currently estimated at $284,923, approximately $280 per square foot. 9612 Hinton Ave is a home located in Merced County with nearby schools including Harmony Elementary School, Delhi High School, and Stanislaus Academy.
Ownership History
Date
Name
Owned For
Owner Type
Purchase Details
Closed on
Oct 10, 2008
Sold by
Wells Fargo Bank Na
Bought by
Espinosa Jesus and Espinoza Esperanza
Current Estimated Value
Purchase Details
Closed on
Aug 8, 2007
Sold by
Magana Jorge
Bought by
Wells Fargo Bank Na
Purchase Details
Closed on
May 3, 2005
Sold by
Magana Elizabeth
Bought by
Magana Jorge
Home Financials for this Owner
Home Financials are based on the most recent Mortgage that was taken out on this home.
Original Mortgage
$186,400
Interest Rate
6.65%
Mortgage Type
Purchase Money Mortgage
Purchase Details
Closed on
Dec 29, 2004
Sold by
Gore Helen
Bought by
Soto James C
Home Financials for this Owner
Home Financials are based on the most recent Mortgage that was taken out on this home.
Original Mortgage
$153,000
Interest Rate
9.25%
Mortgage Type
Purchase Money Mortgage
Create a Home Valuation Report for This Property
The Home Valuation Report is an in-depth analysis detailing your home's value as well as a comparison with similar homes in the area
Home Values in the Area
Average Home Value in this Area
Purchase History
| Date | Buyer | Sale Price | Title Company |
|---|---|---|---|
| Espinosa Jesus | $40,000 | North American Title Company | |
| Wells Fargo Bank Na | $195,627 | None Available | |
| Magana Jorge | -- | Fidelity Title Company | |
| Magana Jorge | $233,000 | Fidelity Title Company | |
| Soto James C | $170,000 | Fidelity Title Company |
Source: Public Records
Mortgage History
| Date | Status | Borrower | Loan Amount |
|---|---|---|---|
| Previous Owner | Magana Jorge | $186,400 | |
| Previous Owner | Soto James C | $153,000 | |
| Closed | Magana Jorge | $46,600 |
Source: Public Records
Tax History Compared to Growth
Tax History
| Year | Tax Paid | Tax Assessment Tax Assessment Total Assessment is a certain percentage of the fair market value that is determined by local assessors to be the total taxable value of land and additions on the property. | Land | Improvement |
|---|---|---|---|---|
| 2025 | $1,160 | $103,007 | $64,382 | $38,625 |
| 2024 | $1,160 | $100,988 | $63,120 | $37,868 |
| 2023 | $1,140 | $99,009 | $61,883 | $37,126 |
| 2022 | $1,110 | $97,069 | $60,670 | $36,399 |
| 2021 | $1,091 | $95,167 | $59,481 | $35,686 |
| 2020 | $1,083 | $94,193 | $58,872 | $35,321 |
| 2019 | $1,067 | $92,347 | $57,718 | $34,629 |
| 2018 | $1,074 | $90,537 | $56,587 | $33,950 |
| 2017 | $1,015 | $88,763 | $55,478 | $33,285 |
| 2016 | $985 | $87,024 | $54,391 | $32,633 |
| 2015 | $975 | $85,717 | $53,574 | $32,143 |
| 2014 | $963 | $84,039 | $52,525 | $31,514 |
Source: Public Records
Map
Nearby Homes
- 0 Hinton Ave Unit 225109602
- 0 4th St
- 16237 Fortune Ct
- 15761 Woods St Unit 24
- 1 Shanks Rd
- 15545 August Ave
- 16752 Bradford Ct
- 0 19 5 Acres On Bloss Ave Unit 225131284
- 0 Golden State Hwy
- 12357 Us-99
- 0 W Bradbury Rd Unit 225095876
- 15861 Oak St
- 7149 Marianna Rd
- 18365 E Clausen Rd
- 10401 Golf Link Rd
- 14127 Vinewood Ave
- 575 Robin Ave
- 2901 Youngstown Rd
- 19206 Bloss Ave
- 8738 N Bellagio Dr
- 9618 Hinton Ave
- 9643 Hillside Ave
- 9600 Hinton Ave
- 9643 Hillside Rd
- 9653 Hillside Rd
- 16031 Schendel Ave
- 16031 Schendel Ave
- 16037 Schendel Ave
- 9663 Hillside Rd
- 16025 Schendel Ave
- 16067 Schendel Ave
- 16018 Schendel Ave
- 9625 Hillside Rd
- 16011 Schendel Ave
- 9613 Hillside Rd
- 9611 Hillside Ave
- 9592 Hinton Ave
- 9611 Hillside Rd
- 9613 Hinton Ave
- 9623 Hinton Ave Unit 12