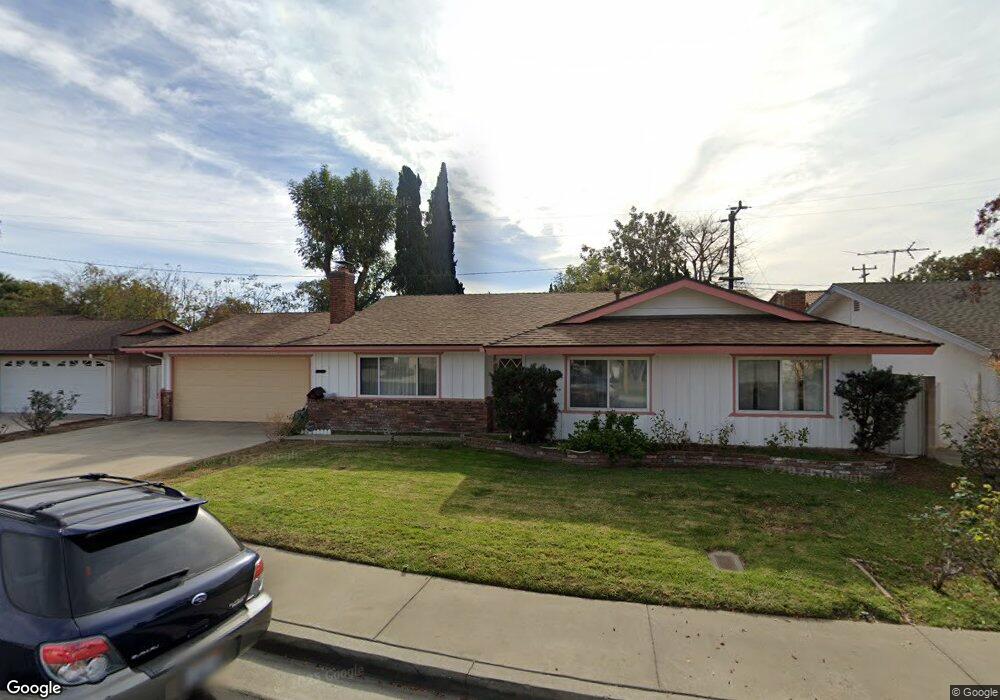
9618 E Le Roy Ave Arcadia, CA 91007
Estimated Value: $1,146,802 - $1,422,000
3
Beds
2
Baths
1,875
Sq Ft
$715/Sq Ft
Est. Value
About This Home
This home is located at 9618 E Le Roy Ave, Arcadia, CA 91007 and is currently estimated at $1,339,701, approximately $714 per square foot. 9618 E Le Roy Ave is a home located in Los Angeles County with nearby schools including Longden Elementary School, Oak Avenue Intermediate School, and Temple City High School.
Ownership History
Date
Name
Owned For
Owner Type
Purchase Details
Closed on
Dec 3, 2025
Sold by
Cherng Nicolas Joseph and Cherng Daniel Thomas
Bought by
Cherng Nicolas Joseph and Cherng Daniel Thomas
Current Estimated Value
Purchase Details
Closed on
Feb 12, 2017
Sold by
Cherng Fung Ying and Cherng Thomas Jin Chao
Bought by
Cherng Fung Ying and Fung Ying Cherng Living Trust
Purchase Details
Closed on
Jul 1, 2015
Sold by
Cherng Fung Ying
Bought by
Cherng Fung Ying and Cherng Thomas Jin Chao
Purchase Details
Closed on
Jan 25, 2005
Sold by
Cherng Feng In Sun
Bought by
Cherng Feng Ing Sun and Feng Ing Sun Cherng Family Tru
Purchase Details
Closed on
Dec 1, 2000
Sold by
Fisher Family Trust Fisher Richard L And Nanc
Bought by
Cherng Fung Ying
Home Financials for this Owner
Home Financials are based on the most recent Mortgage that was taken out on this home.
Original Mortgage
$306,250
Interest Rate
7.54%
Mortgage Type
Stand Alone First
Purchase Details
Closed on
Oct 2, 1998
Sold by
Fisher Richard L and Fisher Nancy L
Bought by
Fisher Richard L and Fisher Nancy L
Create a Home Valuation Report for This Property
The Home Valuation Report is an in-depth analysis detailing your home's value as well as a comparison with similar homes in the area
Home Values in the Area
Average Home Value in this Area
Purchase History
| Date | Buyer | Sale Price | Title Company |
|---|---|---|---|
| Cherng Nicolas Joseph | -- | None Listed On Document | |
| Cherng Fung Ying | -- | None Available | |
| Cherng Fung Ying | -- | None Available | |
| Cherng Feng Ing Sun | -- | -- | |
| Cherng Fung Ying | $350,000 | Lawyers Title Company | |
| Fisher Richard L | -- | -- |
Source: Public Records
Mortgage History
| Date | Status | Borrower | Loan Amount |
|---|---|---|---|
| Previous Owner | Cherng Fung Ying | $306,250 |
Source: Public Records
Tax History
| Year | Tax Paid | Tax Assessment Tax Assessment Total Assessment is a certain percentage of the fair market value that is determined by local assessors to be the total taxable value of land and additions on the property. | Land | Improvement |
|---|---|---|---|---|
| 2025 | $6,460 | $527,377 | $233,551 | $293,826 |
| 2024 | $6,460 | $517,037 | $228,972 | $288,065 |
| 2023 | $6,315 | $506,900 | $224,483 | $282,417 |
| 2022 | $5,917 | $496,962 | $220,082 | $276,880 |
| 2021 | $6,016 | $487,218 | $215,767 | $271,451 |
| 2019 | $5,804 | $472,768 | $209,368 | $263,400 |
| 2018 | $5,645 | $463,499 | $205,263 | $258,236 |
| 2017 | $5,540 | $454,412 | $201,239 | $253,173 |
| 2016 | $5,402 | $445,503 | $197,294 | $248,209 |
| 2015 | $5,311 | $438,812 | $194,331 | $244,481 |
| 2014 | $5,235 | $430,217 | $190,525 | $239,692 |
Source: Public Records
Map
Nearby Homes
- 1222 Temple City Blvd
- 1228 Temple City Blvd
- 1231 S Golden West Ave Unit 3
- 1211 S Golden West Ave Unit C
- 1006 Arcadia Ave Unit D
- 905 W Duarte Rd Unit A
- 1088 Sunset Blvd Unit A
- 1027 Arcadia Ave Unit C
- 1140 Arcadia Ave
- 9163 Duarte Rd
- 6771 Oak Ave
- 946 Fairview Ave Unit 8
- 1126 Fairview Ave Unit 210
- 1126 Fairview Ave Unit 106
- 905 Sunset Blvd Unit A
- 914 Fairview Ave Unit 13
- 9144 E Fairview Ave
- 1150 Okoboji Dr
- 1124 W Huntington Dr Unit 2
- 1522 S Baldwin Ave Unit 15
- 9622 E Le Roy Ave
- 9612 E Le Roy Ave
- 9621 E Naomi Ave
- 9627 E Naomi Ave
- 9623 E Le Roy Ave
- 9619 E Le Roy Ave
- 6810 Temple City Blvd
- 9615 E Naomi Ave
- 9637 E Naomi Ave
- 9611 E Le Roy Ave
- 9635 E Naomi Ave
- 9604 E Le Roy Ave
- 9639 E Naomi Ave
- 9633 E Naomi Ave
- 9641 E Naomi Ave
- 6804 Temple City Blvd
- 9605 E Le Roy Ave
- 9624 E Naomi Ave
- 1222 Temple City Blvd Unit 10
- 1222 Temple City Blvd Unit 8
Your Personal Tour Guide
Ask me questions while you tour the home.