9624 232nd St SW Edmonds, WA 98020
Sherwood Forest NeighborhoodEstimated Value: $816,539 - $1,228,000
4
Beds
2
Baths
1,383
Sq Ft
$678/Sq Ft
Est. Value
About This Home
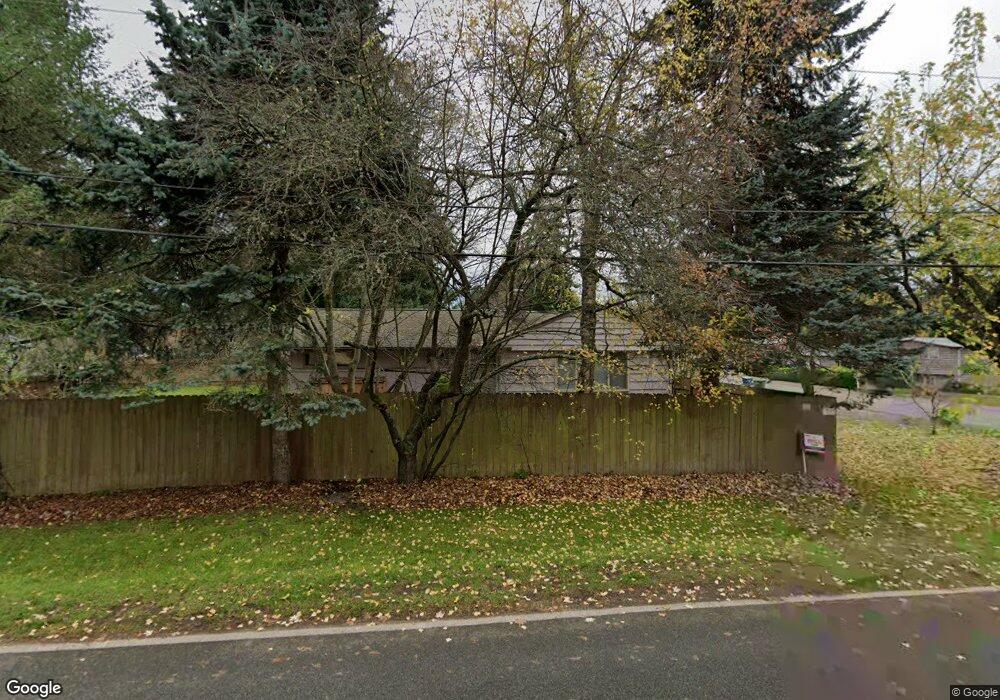
This home is located at 9624 232nd St SW, Edmonds, WA 98020 and is currently estimated at $938,135, approximately $678 per square foot. 9624 232nd St SW is a home located in Snohomish County with nearby schools including Sherwood Elementary School, College Place Middle School, and Edmonds-Woodway High School.
Ownership History
Date
Name
Owned For
Owner Type
Purchase Details
Closed on
Mar 10, 2022
Sold by
Sayward Adams
Bought by
Adams Kyle E Reis
Current Estimated Value
Home Financials for this Owner
Home Financials are based on the most recent Mortgage that was taken out on this home.
Original Mortgage
$66,316
Outstanding Balance
$61,697
Interest Rate
3.55%
Mortgage Type
New Conventional
Estimated Equity
$876,438
Purchase Details
Closed on
Sep 18, 2010
Sold by
Dullum Douglas and Dullum Heidi
Bought by
Jpmorgan Chase Bank National Association
Purchase Details
Closed on
Apr 1, 2006
Sold by
Greer Sharon and Greer Sharon E Cathcart
Bought by
Dullum Douglas and Dullum Heidi
Home Financials for this Owner
Home Financials are based on the most recent Mortgage that was taken out on this home.
Original Mortgage
$240,000
Interest Rate
6.15%
Mortgage Type
Purchase Money Mortgage
Purchase Details
Closed on
Nov 17, 1999
Sold by
Greer Michael C and Cathcart Greer Sharon E
Bought by
Cathcart Greer Sharon E
Create a Home Valuation Report for This Property
The Home Valuation Report is an in-depth analysis detailing your home's value as well as a comparison with similar homes in the area
Home Values in the Area
Average Home Value in this Area
Purchase History
| Date | Buyer | Sale Price | Title Company |
|---|---|---|---|
| Adams Kyle E Reis | $313 | Chicago Title | |
| Jpmorgan Chase Bank National Association | $395,435 | Northwest Title | |
| Dullum Douglas | $300,000 | The Talon Group | |
| Cathcart Greer Sharon E | -- | -- |
Source: Public Records
Mortgage History
| Date | Status | Borrower | Loan Amount |
|---|---|---|---|
| Open | Adams Kyle E Reis | $66,316 | |
| Previous Owner | Dullum Douglas | $240,000 |
Source: Public Records
Tax History Compared to Growth
Tax History
| Year | Tax Paid | Tax Assessment Tax Assessment Total Assessment is a certain percentage of the fair market value that is determined by local assessors to be the total taxable value of land and additions on the property. | Land | Improvement |
|---|---|---|---|---|
| 2025 | $4,956 | $720,100 | $577,200 | $142,900 |
| 2024 | $4,956 | $695,200 | $552,300 | $142,900 |
| 2023 | $5,056 | $734,900 | $576,100 | $158,800 |
| 2022 | $4,705 | $562,400 | $442,900 | $119,500 |
| 2020 | $4,689 | $501,300 | $347,300 | $154,000 |
| 2019 | $4,353 | $468,800 | $318,400 | $150,400 |
| 2018 | $4,374 | $407,100 | $272,400 | $134,700 |
| 2017 | $3,690 | $359,300 | $235,400 | $123,900 |
| 2016 | $3,348 | $327,300 | $208,400 | $118,900 |
| 2015 | $3,324 | $306,000 | $228,000 | $78,000 |
| 2013 | $1,254 | $218,100 | $147,000 | $71,100 |
Source: Public Records
Map
Nearby Homes
- 9801 234th St SW Unit 1
- 9526 234th St SW
- 23024 99th Ave W
- 23511 96th Ave W
- 9511 Edmonds Way
- 23227 92nd Ave W
- 22910 90th Ave W Unit C306
- 23015 Edmonds Way Unit A103
- 23121 Edmonds Way Unit 2
- 8825 231st Place SW
- 23601 Edmonds Way
- 22212 98th Ave W
- 8614 Madrona Ln
- 22039 98th Place W
- 8615 238th St SW Unit B101
- 24012 102nd Place W
- 22628 106th Ave W
- 1221 Coronado Place
- 7522 221st St SW
- 9906 242nd Place SW
- 23215 97th Ave W
- 23206 96th Ave W
- 23123 97th Ave W
- 9623 232nd St SW
- 23206 97th Ave W
- 23214 97th Ave W
- 9607 232nd St SW
- 23220 97th Ave W
- 23126 97th Ave W
- 23228 96th Ave W
- 9617 233rd St SW
- 23301 97th Ave W
- 23109 97th Ave W
- 9706 231st Place SW
- 23228 97th Ave W
- 9516 232nd St SW
- 9529 232nd St SW
- 23215 96th Ave W