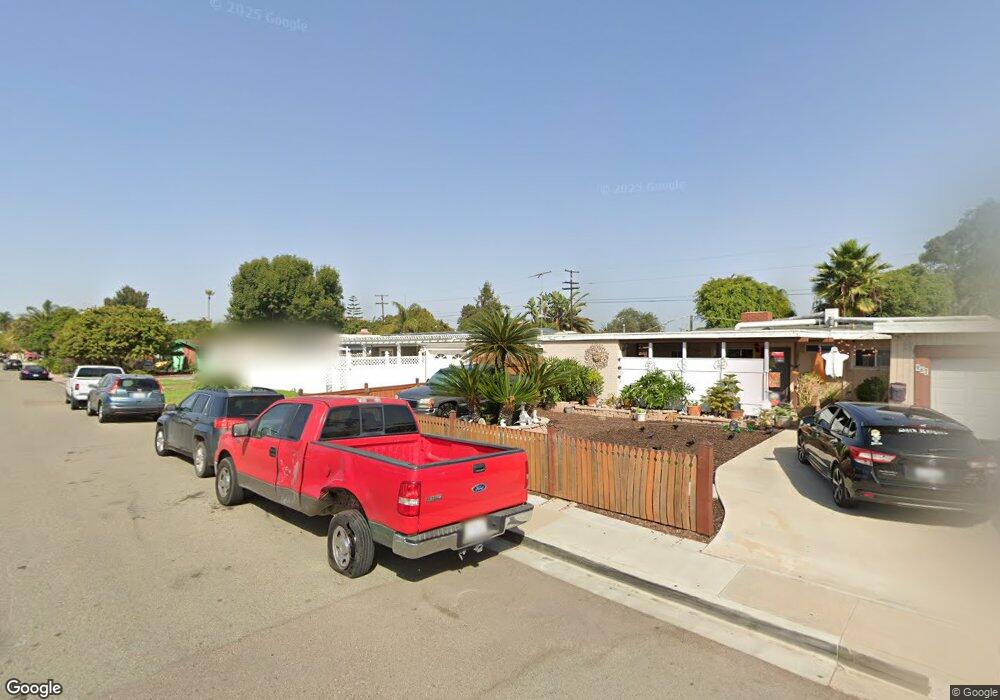
963 Agua Tibia Ave Chula Vista, CA 91911
Castle Park NeighborhoodEstimated Value: $725,000 - $849,000
3
Beds
2
Baths
1,554
Sq Ft
$509/Sq Ft
Est. Value
About This Home
This home is located at 963 Agua Tibia Ave, Chula Vista, CA 91911 and is currently estimated at $790,933, approximately $508 per square foot. 963 Agua Tibia Ave is a home located in San Diego County with nearby schools including Cook Elementary School, Hilltop Middle School, and Hilltop Senior High School.
Ownership History
Date
Name
Owned For
Owner Type
Purchase Details
Closed on
Feb 21, 1997
Sold by
Nerat Terrence A
Bought by
Kankelborg Lyle J and Kankelborg Rosario R
Current Estimated Value
Home Financials for this Owner
Home Financials are based on the most recent Mortgage that was taken out on this home.
Original Mortgage
$158,100
Outstanding Balance
$16,981
Interest Rate
7.63%
Mortgage Type
VA
Estimated Equity
$773,952
Create a Home Valuation Report for This Property
The Home Valuation Report is an in-depth analysis detailing your home's value as well as a comparison with similar homes in the area
Home Values in the Area
Average Home Value in this Area
Purchase History
| Date | Buyer | Sale Price | Title Company |
|---|---|---|---|
| Kankelborg Lyle J | $155,000 | Southland Title |
Source: Public Records
Mortgage History
| Date | Status | Borrower | Loan Amount |
|---|---|---|---|
| Open | Kankelborg Lyle J | $158,100 |
Source: Public Records
Tax History
| Year | Tax Paid | Tax Assessment Tax Assessment Total Assessment is a certain percentage of the fair market value that is determined by local assessors to be the total taxable value of land and additions on the property. | Land | Improvement |
|---|---|---|---|---|
| 2025 | $2,950 | $252,414 | $63,129 | $189,285 |
| 2024 | $2,845 | $247,466 | $61,892 | $185,574 |
| 2023 | $2,804 | $242,615 | $60,679 | $181,936 |
| 2022 | $2,722 | $237,859 | $59,490 | $178,369 |
| 2021 | $2,658 | $233,196 | $58,324 | $174,872 |
| 2020 | $2,594 | $230,805 | $57,726 | $173,079 |
| 2019 | $2,526 | $226,281 | $56,595 | $169,686 |
| 2018 | $2,486 | $221,845 | $55,486 | $166,359 |
| 2017 | $10 | $217,497 | $54,399 | $163,098 |
| 2016 | $2,373 | $213,233 | $53,333 | $159,900 |
| 2015 | $2,339 | $210,031 | $52,532 | $157,499 |
| 2014 | $2,299 | $205,917 | $51,503 | $154,414 |
Source: Public Records
Map
Nearby Homes
- 927 Agua Tibia Ave
- 1054 Cuyamaca Ave
- 75 E Naples St
- 881 1st Ave
- 953 Maria Way
- 112 Country Club Dr
- 902 Monterey Ct
- 939 Nolan Way
- 1040 2nd Ave
- 1236 Tobias Dr
- 202 E J St
- 1268 Helix Ave
- 268 Sierra Way
- 279 Moss St Unit 10
- 285 Moss St Unit 64
- 285 Moss St Unit 9
- 655 Robert Ave
- 376 Roman Way
- 161 E Palomar St
- 145-47 Glenhaven Way
- 957 Agua Tibia Ave
- 967 Agua Tibia Ave
- 953 Agua Tibia Ave
- 971 Agua Tibia Ave
- 947 Agua Tibia Ave
- 962 Agua Tibia Ave
- 958 Agua Tibia Ave
- 968 Agua Tibia Ave
- 977 Agua Tibia Ave
- 952 Agua Tibia Ave
- 38 E Donahoe St
- 972 Agua Tibia Ave
- 943 Agua Tibia Ave
- 948 Agua Tibia Ave
- 981 Agua Tibia Ave
- 976 Agua Tibia Ave
- 44 E Donahoe St
- 942 Agua Tibia Ave
- 963 Hilltop Dr
- 988 Barrett Ave
Your Personal Tour Guide
Ask me questions while you tour the home.