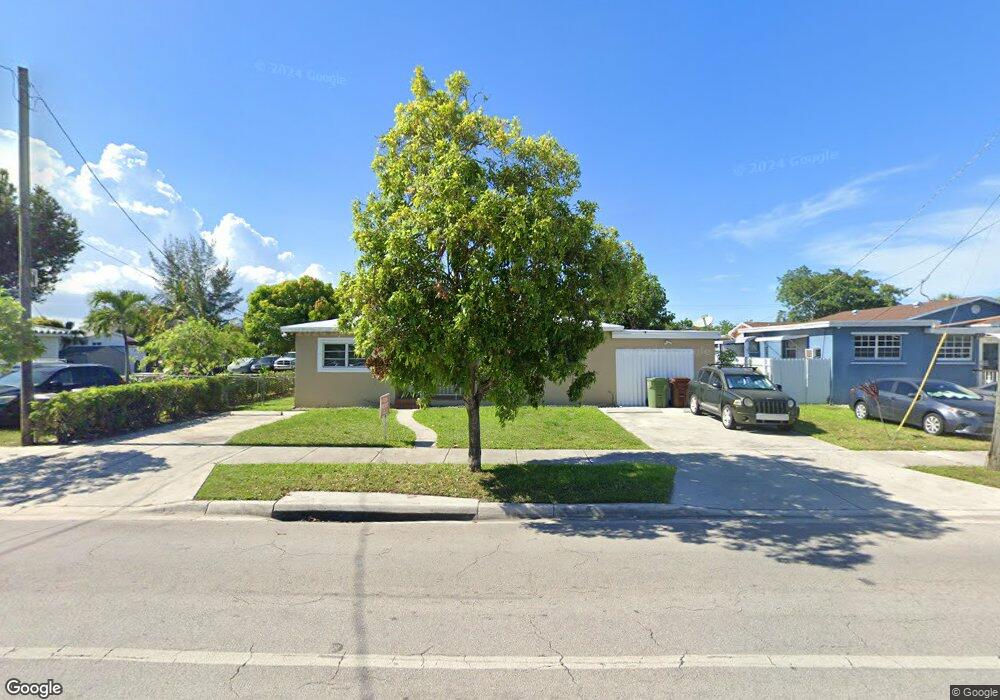
963 E 52nd St Hialeah, FL 33013
Estimated Value: $550,030 - $684,000
2
Beds
1
Bath
1,176
Sq Ft
$509/Sq Ft
Est. Value
About This Home
This home is located at 963 E 52nd St, Hialeah, FL 33013 and is currently estimated at $598,008, approximately $508 per square foot. 963 E 52nd St is a home located in Miami-Dade County with nearby schools including Hialeah Middle School, Hialeah Senior High School, and Robert Morgan Educational Center.
Ownership History
Date
Name
Owned For
Owner Type
Purchase Details
Closed on
May 6, 2014
Sold by
Ayers Charles Major
Bought by
Cordova Pedro R and Cordova Elisa L
Current Estimated Value
Home Financials for this Owner
Home Financials are based on the most recent Mortgage that was taken out on this home.
Original Mortgage
$140,000
Interest Rate
5%
Mortgage Type
Seller Take Back
Purchase Details
Closed on
Oct 15, 2009
Sold by
Ayers Charles Major
Bought by
Ayers Charles Major and Myers Wesley
Create a Home Valuation Report for This Property
The Home Valuation Report is an in-depth analysis detailing your home's value as well as a comparison with similar homes in the area
Home Values in the Area
Average Home Value in this Area
Purchase History
| Date | Buyer | Sale Price | Title Company |
|---|---|---|---|
| Cordova Pedro R | $160,000 | Attorney | |
| Ayers Charles Major | -- | Attorney |
Source: Public Records
Mortgage History
| Date | Status | Borrower | Loan Amount |
|---|---|---|---|
| Closed | Cordova Pedro R | $140,000 |
Source: Public Records
Tax History
| Year | Tax Paid | Tax Assessment Tax Assessment Total Assessment is a certain percentage of the fair market value that is determined by local assessors to be the total taxable value of land and additions on the property. | Land | Improvement |
|---|---|---|---|---|
| 2025 | $7,250 | $382,929 | -- | -- |
| 2024 | $6,335 | $348,118 | -- | -- |
| 2023 | $6,335 | $316,471 | $0 | $0 |
| 2022 | $5,704 | $287,701 | $0 | $0 |
| 2021 | $5,041 | $261,547 | $164,349 | $97,198 |
| 2020 | $4,748 | $256,465 | $163,992 | $92,473 |
| 2019 | $4,383 | $241,009 | $153,273 | $87,736 |
| 2018 | $0 | $224,669 | $139,339 | $85,330 |
| 2017 | $3,537 | $179,830 | $0 | $0 |
| 2016 | $3,197 | $163,482 | $0 | $0 |
| 2015 | $1,343 | $151,691 | $0 | $0 |
| 2014 | $1,343 | $106,317 | $0 | $0 |
Source: Public Records
Map
Nearby Homes
- 5150 E 9th Ln
- 5066 E 9th Ct
- 5168 E 8th Ln
- 4851 E 8th Ct
- 10529 NW 37th Ave
- 991 E 47th St
- 671 E 53rd St
- 4631 E 8th Ct
- 10330 NW 36th Ct
- 691 E 48th St
- 631 E 53rd St
- 10325 NW 36th Ct
- 3575 NW 103rd St
- 5005 E 6th Ave
- 3601 NW 102nd St
- 614 E 56th St
- 4465 E 8th Ln
- 10521 NW 35th Ct
- 4485 E 8th Ave
- 625 E 57th St
Your Personal Tour Guide
Ask me questions while you tour the home.