Estimated payment $3,086/month
Highlights
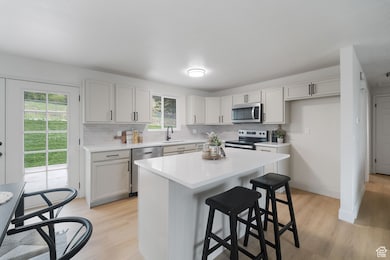
- Updated Kitchen
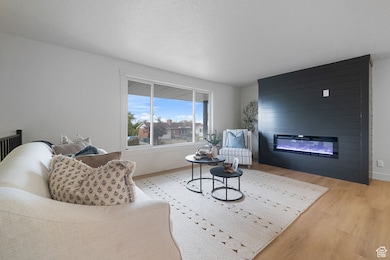
- 2 Fireplaces
- No HOA
- Eastmont Middle School Rated A-
- Granite Countertops
- 1 Car Attached Garage
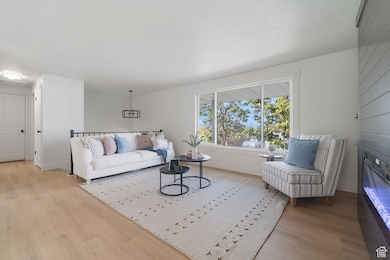
About This Home
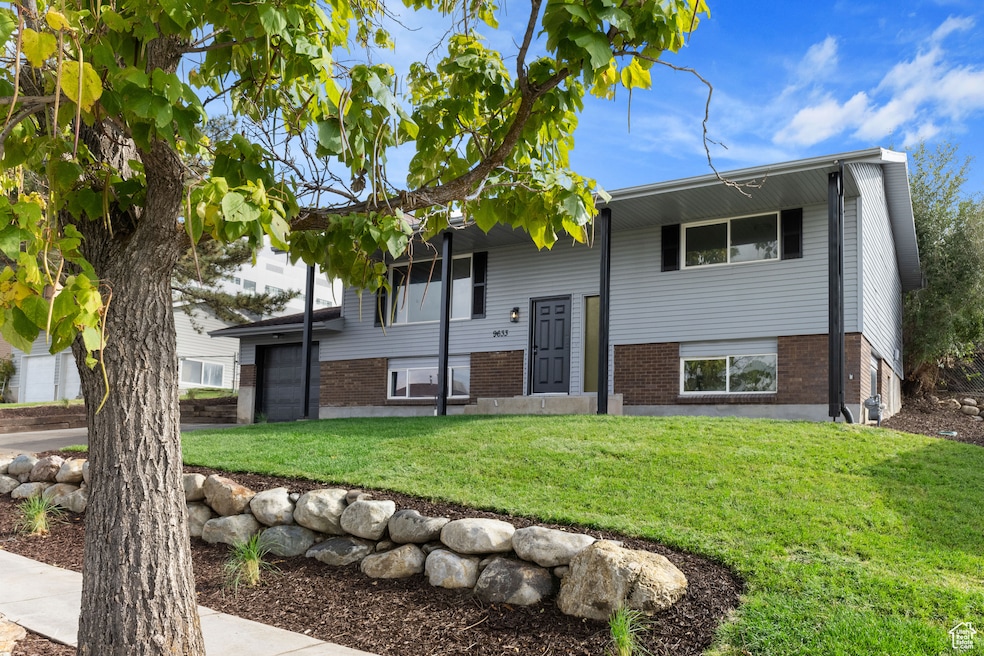
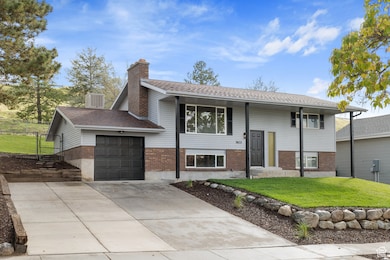
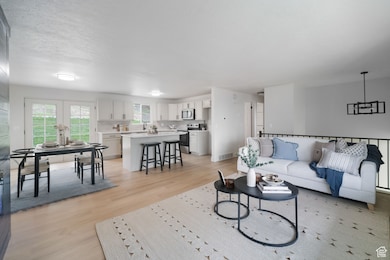
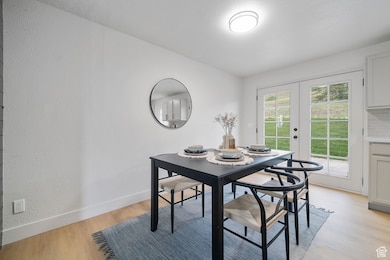
This beautiful Sandy home is on a quiet street with no neighbors behind you. It has been completely updated. New paint and flooring throughout, Brand new kitchen and baths with quartz countertops and brand new stainless steel appliances. Newer roof and central air as well! Fully landscaped and fenced back yard. Square footage figures are provided as a courtesy estimate only. Seller is a licensed real estate agent. **Staging has been removed**
Home Details
Home Type
- Single Family
Est. Annual Taxes
- $2,328
Year Built
- Built in 1975
Lot Details
- 7,841 Sq Ft Lot
- West Facing Home
- Property is Fully Fenced
- Landscaped
- Sprinkler System
- Property is zoned Single-Family, 1108
Parking
- 1 Car Attached Garage
- 3 Open Parking Spaces
Home Design
- Split Level Home
- Asphalt Roof
Interior Spaces
- 1,920 Sq Ft Home
- 2-Story Property
- 2 Fireplaces
- Carpet
- Basement Fills Entire Space Under The House
- Smart Thermostat
- Gas Dryer Hookup
Kitchen
- Updated Kitchen
- Gas Range
- Granite Countertops
- Disposal
Bedrooms and Bathrooms
- 4 Bedrooms | 2 Main Level Bedrooms
Schools
- Alta View Elementary School
- Eastmont Middle School
- Alta High School
Utilities
- Central Heating and Cooling System
- Natural Gas Connected
Community Details
- No Home Owners Association
- White City Subdivision
Listing and Financial Details
- Assessor Parcel Number 28-08-230-013
Map
Home Values in the Area
Average Home Value in this Area
Tax History
| Year | Tax Paid | Tax Assessment Tax Assessment Total Assessment is a certain percentage of the fair market value that is determined by local assessors to be the total taxable value of land and additions on the property. | Land | Improvement |
|---|---|---|---|---|
| 2025 | $2,328 | $461,100 | $121,100 | $340,000 |
| 2024 | $2,328 | $446,500 | $113,200 | $333,300 |
| 2023 | $2,328 | $391,600 | $107,600 | $284,000 |
| 2022 | $2,179 | $401,400 | $105,500 | $295,900 |
| 2021 | $1,890 | $296,700 | $82,000 | $214,700 |
| 2020 | $1,837 | $272,100 | $82,000 | $190,100 |
| 2019 | $1,750 | $252,700 | $77,400 | $175,300 |
| 2018 | $1,485 | $223,700 | $77,400 | $146,300 |
| 2017 | $1,498 | $215,700 | $77,400 | $138,300 |
| 2016 | $1,400 | $195,200 | $77,400 | $117,800 |
| 2015 | $1,363 | $175,800 | $75,100 | $100,700 |
| 2014 | $1,401 | $177,200 | $76,600 | $100,600 |
Property History
| Date | Event | Price | List to Sale | Price per Sq Ft |
|---|---|---|---|---|
| 02/10/2026 02/10/26 | Pending | -- | -- | -- |
| 01/09/2026 01/09/26 | Price Changed | $549,900 | -3.5% | $286 / Sq Ft |
| 01/05/2026 01/05/26 | Price Changed | $569,900 | -0.5% | $297 / Sq Ft |
| 12/26/2025 12/26/25 | Price Changed | $572,900 | -0.2% | $298 / Sq Ft |
| 12/15/2025 12/15/25 | Price Changed | $573,900 | -0.2% | $299 / Sq Ft |
| 11/24/2025 11/24/25 | Price Changed | $574,800 | 0.0% | $299 / Sq Ft |
| 11/19/2025 11/19/25 | Price Changed | $574,900 | -1.7% | $299 / Sq Ft |
| 11/17/2025 11/17/25 | Price Changed | $584,900 | -0.7% | $305 / Sq Ft |
| 11/09/2025 11/09/25 | Price Changed | $588,900 | -0.2% | $307 / Sq Ft |
| 11/05/2025 11/05/25 | Price Changed | $589,900 | -0.7% | $307 / Sq Ft |
| 11/03/2025 11/03/25 | Price Changed | $593,900 | -0.2% | $309 / Sq Ft |
| 10/20/2025 10/20/25 | Price Changed | $594,990 | -0.8% | $310 / Sq Ft |
| 10/16/2025 10/16/25 | For Sale | $599,900 | -- | $312 / Sq Ft |
Purchase History
| Date | Type | Sale Price | Title Company |
|---|---|---|---|
| Special Warranty Deed | -- | None Listed On Document | |
| Warranty Deed | -- | Title Guarantee | |
| Warranty Deed | -- | Title Guarantee |
Mortgage History
| Date | Status | Loan Amount | Loan Type |
|---|---|---|---|
| Open | $380,000 | New Conventional | |
| Closed | $380,000 | New Conventional |
Source: UtahRealEstate.com
MLS Number: 2117888
APN: 28-08-230-013-0000
Disclaimer: Certain information contained herein is derived from information provided by parties other than Homes.com. All information provided is deemed reliable, but is not guaranteed to be accurate and should be independently verified.
![]() IDX information is provided exclusively for consumers’ personal, non-commercial use, that it may not be used for any purpose other than to identify prospective properties consumers may be interested in purchasing, and that the data is deemed reliable but is not guaranteed accurate by the MLS. Licensor is only providing the MLS Content and not other sources of data provided in the Product.
IDX information is provided exclusively for consumers’ personal, non-commercial use, that it may not be used for any purpose other than to identify prospective properties consumers may be interested in purchasing, and that the data is deemed reliable but is not guaranteed accurate by the MLS. Licensor is only providing the MLS Content and not other sources of data provided in the Product.
Based on information from the Wasatch Front Regional Multiple Listing Service, Inc.. All data, including all measurements and calculations of area, is obtained from various sources and has not been, and will not be, verified by broker or the MLS. All information should be independently reviewed and verified for accuracy. Properties may or may not be listed by the office/agent presenting the information.
- 1105 E Webster Dr
- 9587 S 1040 E
- 1469 Winterwood Cir
- 9976 Tamara St E
- 9968 S Blossom Dr
- 1492 E Sandy Hills Dr
- 1242 Earl Way
- 1563 E Tameron Dr
- 1584 Petunia Way
- 9828 Pinehurst Dr
- 9971 Pinehurst Dr
- 1123 E Sego Lily Dr
- 9979 S Albury Rd
- 1650 E Budding Dr
- 1138 E Quarry Stone Way
- 10172 Snow Iris Way
- 1482 Waters Ln
- 918 Lazon Dr
- 9218 S Laura Anne Way
- 9472 S Tramway Dr

Ask me questions while you tour the home.