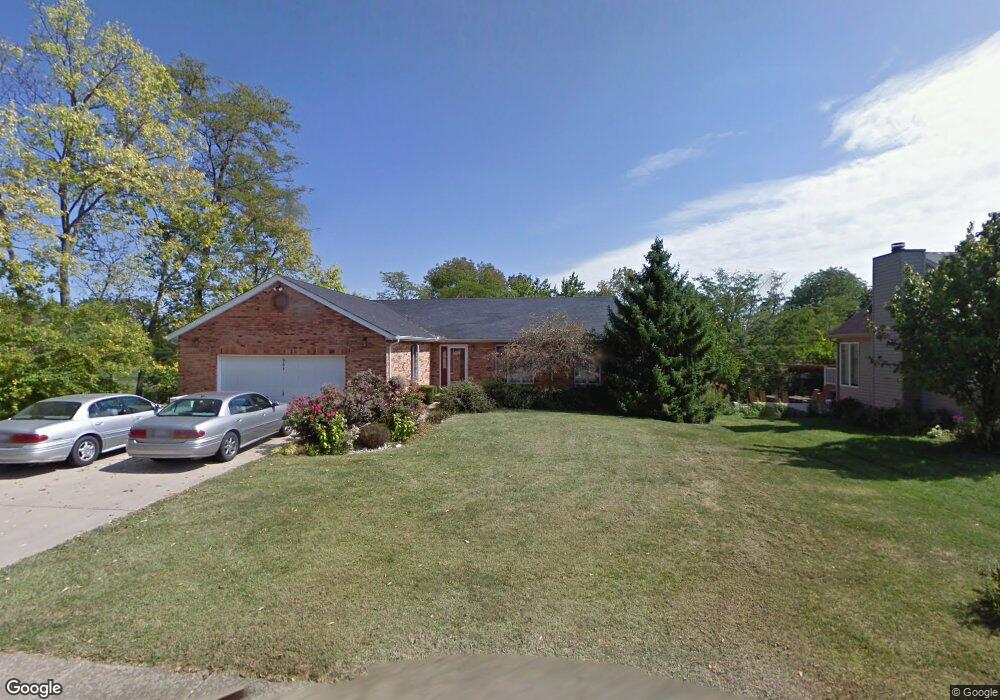
964 Kerns Ave Lebanon, OH 45036
Estimated Value: $278,000 - $340,000
3
Beds
2
Baths
1,624
Sq Ft
$192/Sq Ft
Est. Value
About This Home
This home is located at 964 Kerns Ave, Lebanon, OH 45036 and is currently estimated at $312,177, approximately $192 per square foot. 964 Kerns Ave is a home located in Warren County with nearby schools including Bowman Primary School, Berry Intermediate School, and Donovan Elementary School.
Ownership History
Date
Name
Owned For
Owner Type
Purchase Details
Closed on
Sep 28, 2007
Sold by
Conn David M and Conn Donna
Bought by
Gould Gregory and Gould Christina
Current Estimated Value
Home Financials for this Owner
Home Financials are based on the most recent Mortgage that was taken out on this home.
Original Mortgage
$116,800
Outstanding Balance
$74,211
Interest Rate
6.55%
Mortgage Type
Unknown
Estimated Equity
$237,966
Purchase Details
Closed on
Jun 10, 1996
Sold by
Conn W Dennis
Bought by
Conn David M
Home Financials for this Owner
Home Financials are based on the most recent Mortgage that was taken out on this home.
Original Mortgage
$90,000
Interest Rate
7.97%
Mortgage Type
Balloon
Purchase Details
Closed on
May 28, 1993
Sold by
Conn W Dennis W and Conn Irma H
Bought by
Conn and Dennis W
Purchase Details
Closed on
Oct 27, 1987
Sold by
Dpbf & Inc
Bought by
Conn and Dennis W
Purchase Details
Closed on
Oct 22, 1987
Sold by
Dpbf & Inc
Bought by
Dpbf & Inc.
Create a Home Valuation Report for This Property
The Home Valuation Report is an in-depth analysis detailing your home's value as well as a comparison with similar homes in the area
Home Values in the Area
Average Home Value in this Area
Purchase History
| Date | Buyer | Sale Price | Title Company |
|---|---|---|---|
| Gould Gregory | $146,000 | Technetitle | |
| Conn David M | $130,000 | -- | |
| Conn | -- | -- | |
| Conn | $16,900 | -- | |
| Dpbf & Inc. | -- | -- |
Source: Public Records
Mortgage History
| Date | Status | Borrower | Loan Amount |
|---|---|---|---|
| Open | Gould Gregory | $116,800 | |
| Closed | Conn David M | $90,000 |
Source: Public Records
Tax History Compared to Growth
Tax History
| Year | Tax Paid | Tax Assessment Tax Assessment Total Assessment is a certain percentage of the fair market value that is determined by local assessors to be the total taxable value of land and additions on the property. | Land | Improvement |
|---|---|---|---|---|
| 2024 | $3,571 | $84,050 | $21,000 | $63,050 |
| 2023 | $3,151 | $66,696 | $10,762 | $55,933 |
| 2022 | $3,280 | $66,696 | $10,763 | $55,934 |
| 2021 | $3,099 | $66,696 | $10,763 | $55,934 |
| 2020 | $2,983 | $54,226 | $8,750 | $45,476 |
| 2019 | $2,937 | $54,226 | $8,750 | $45,476 |
| 2018 | $2,517 | $54,226 | $8,750 | $45,476 |
| 2017 | $2,358 | $45,591 | $7,480 | $38,112 |
| 2016 | $2,433 | $45,591 | $7,480 | $38,112 |
| 2015 | $2,451 | $45,591 | $7,480 | $38,112 |
| 2014 | $2,552 | $45,590 | $7,480 | $38,110 |
| 2013 | $2,455 | $53,330 | $8,750 | $44,580 |
Source: Public Records
Map
Nearby Homes
- 1112 Hubbell Ct
- 917 Kerns Dr
- 1 Dryhill Ct
- 1443 N Broadway St
- 911 Birchwood Dr
- 1033 Country Creek Dr
- 465 Creekside Dr
- 531 Quail Ct
- 11 Roxie Ct
- 532 French Run Ct
- 908 Hartz Dr
- 19 Hathaway Commons
- 781 Oleander Ct
- 364 Grey's Run
- 351 Grey's Run
- 376 Grey's Run
- 5 Acres Lot D Phillips Rd
- 409 Bethpage Way Unit 7-301
- 5 Acres Ave
- 409 Bethpage Way