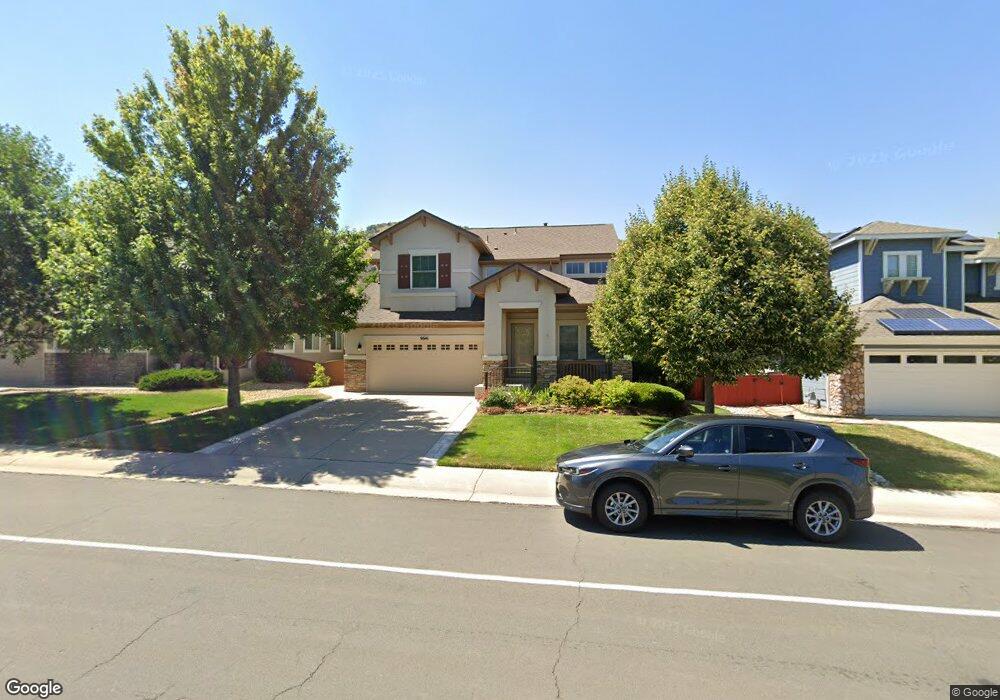
9641 S Johnson St Littleton, CO 80127
Estimated Value: $821,016 - $946,000
4
Beds
7
Baths
2,266
Sq Ft
$391/Sq Ft
Est. Value
About This Home
This home is located at 9641 S Johnson St, Littleton, CO 80127 and is currently estimated at $886,004, approximately $390 per square foot. 9641 S Johnson St is a home located in Jefferson County with nearby schools including Shaffer Elementary School, Falcon Bluffs Middle School, and Chatfield High School.
Ownership History
Date
Name
Owned For
Owner Type
Purchase Details
Closed on
Jun 24, 2005
Sold by
Prudential Residential Services Lp
Bought by
Farish Andrew and Farish Sandra S
Current Estimated Value
Home Financials for this Owner
Home Financials are based on the most recent Mortgage that was taken out on this home.
Original Mortgage
$196,000
Outstanding Balance
$101,466
Interest Rate
5.63%
Mortgage Type
Credit Line Revolving
Estimated Equity
$784,538
Purchase Details
Closed on
Oct 31, 2002
Sold by
Shea Homes Ltd Partnership
Bought by
Wegher Jeffrey G and Wegher Jennifer M
Home Financials for this Owner
Home Financials are based on the most recent Mortgage that was taken out on this home.
Original Mortgage
$278,350
Interest Rate
5.95%
Create a Home Valuation Report for This Property
The Home Valuation Report is an in-depth analysis detailing your home's value as well as a comparison with similar homes in the area
Home Values in the Area
Average Home Value in this Area
Purchase History
| Date | Buyer | Sale Price | Title Company |
|---|---|---|---|
| Farish Andrew | $440,000 | Chicago Title Co | |
| Prudential Residential Services Lp | $440,000 | Chicago Title Co | |
| Wegher Jeffrey G | $347,958 | North American Title |
Source: Public Records
Mortgage History
| Date | Status | Borrower | Loan Amount |
|---|---|---|---|
| Open | Prudential Residential Services Lp | $196,000 | |
| Closed | Farish Andrew | $200,000 | |
| Previous Owner | Wegher Jeffrey G | $278,350 |
Source: Public Records
Tax History Compared to Growth
Tax History
| Year | Tax Paid | Tax Assessment Tax Assessment Total Assessment is a certain percentage of the fair market value that is determined by local assessors to be the total taxable value of land and additions on the property. | Land | Improvement |
|---|---|---|---|---|
| 2024 | $4,733 | $50,173 | $13,899 | $36,274 |
| 2023 | $4,733 | $50,173 | $13,899 | $36,274 |
| 2022 | $4,259 | $44,335 | $12,622 | $31,713 |
| 2021 | $4,334 | $45,611 | $12,985 | $32,626 |
| 2020 | $3,865 | $40,789 | $10,118 | $30,671 |
| 2019 | $3,835 | $40,789 | $10,118 | $30,671 |
| 2018 | $3,556 | $38,237 | $10,766 | $27,471 |
| 2017 | $4,054 | $38,237 | $10,766 | $27,471 |
| 2016 | $3,748 | $32,149 | $8,253 | $23,896 |
| 2015 | $3,429 | $32,149 | $8,253 | $23,896 |
| 2014 | $3,429 | $28,067 | $7,490 | $20,577 |
Source: Public Records
Map
Nearby Homes
- 9921 W Edenburg Place
- 9788 S Johnson Way
- 9896 W Freiburg Dr Unit 1D
- 9896 W Freiburg Dr Unit 1B
- 9876 W Freiburg Dr Unit F
- 9836 W Freiburg Dr Unit 4B
- 9796 W Freiburg Dr Unit H
- 9816 S Holland St
- 9407 W Gibraltar Place
- 9610 S Dover Way
- 8532 W Eden Dr
- 10062 W Victoria Place Unit 205
- 9992 W Victoria Place Unit 103
- 9962 W Victoria Place Unit 102
- 10061 W Victoria Place Unit 204
- 10056 W Unser Dr Unit 204
- 8808 S Kipling Way Unit 202
- 8779 S Kipling Way Unit 105
- 8779 S Kipling Way Unit 204
- 8778 S Kipling Way Unit 303
- 9651 S Johnson St
- 9631 S Johnson St
- 9661 S Johnson St
- 9621 S Johnson St
- 9650 S Johnson St
- 9640 S Johnson St
- 9671 S Johnson St
- 9660 S Johnson St
- 9620 S Johnson St
- 9670 S Johnson St
- 9846 W Danzig Place
- 9610 S Johnson St
- 9600 S Johnson St
- 9681 S Johnson St
- 9680 S Johnson St
- 9865 W Danzig Place
- 9826 W Danzig Place
- 9690 S Johnson St
- 9691 S Johnson St
- 9659 S Jellison Way