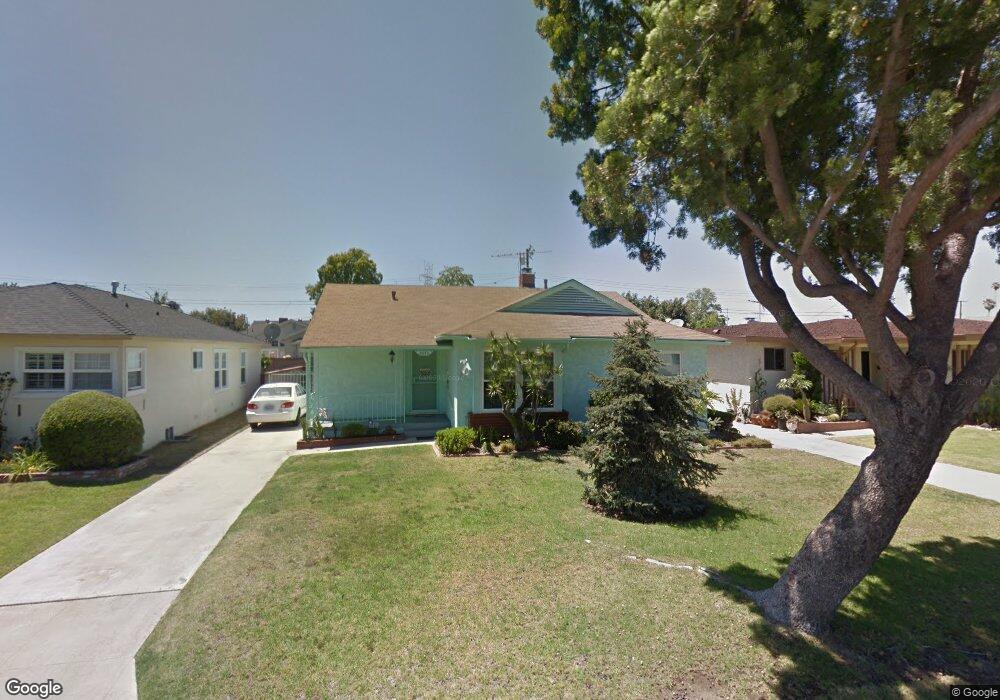
9643 Julius Ave Downey, CA 90240
Estimated Value: $807,692 - $885,000
3
Beds
2
Baths
1,282
Sq Ft
$660/Sq Ft
Est. Value
About This Home
This home is located at 9643 Julius Ave, Downey, CA 90240 and is currently estimated at $845,673, approximately $659 per square foot. 9643 Julius Ave is a home located in Los Angeles County with nearby schools including Price Elementary School, Griffiths Middle School, and Warren High School.
Ownership History
Date
Name
Owned For
Owner Type
Purchase Details
Closed on
Sep 6, 2019
Sold by
Krupp Elaine L
Bought by
Krupp Elaine L and The 2005 Krupp Revocable Trust
Current Estimated Value
Home Financials for this Owner
Home Financials are based on the most recent Mortgage that was taken out on this home.
Original Mortgage
$922,500
Outstanding Balance
$809,923
Interest Rate
3.82%
Mortgage Type
FHA
Estimated Equity
$35,750
Purchase Details
Closed on
Jul 13, 2007
Sold by
Krupp Elaine L
Bought by
Krupp Elaine L and 2005 Krupp Revocable Trust
Purchase Details
Closed on
Dec 28, 2005
Sold by
Krupp Elanie
Bought by
Krupp Elaine Louise and 2005 Krupp Revocable Trust
Purchase Details
Closed on
Nov 18, 2003
Sold by
Schustek Gertrude and The Schustek Family Living Tru
Bought by
Krupp Elaine
Purchase Details
Closed on
Sep 6, 1996
Sold by
Schustek Walter and Schustek Gertrude
Bought by
Schustek Walter and Schustek Gertrude
Create a Home Valuation Report for This Property
The Home Valuation Report is an in-depth analysis detailing your home's value as well as a comparison with similar homes in the area
Purchase History
| Date | Buyer | Sale Price | Title Company |
|---|---|---|---|
| Krupp Elaine L | -- | Fidelity National Title | |
| Krupp Elaine L | -- | None Available | |
| Krupp Elaine Louise | -- | None Available | |
| Krupp Elaine | $382,000 | Equity Title | |
| Schustek Walter | -- | -- |
Source: Public Records
Mortgage History
| Date | Status | Borrower | Loan Amount |
|---|---|---|---|
| Open | Krupp Elaine L | $922,500 | |
| Closed | Krupp Elaine | $0 |
Source: Public Records
Tax History
| Year | Tax Paid | Tax Assessment Tax Assessment Total Assessment is a certain percentage of the fair market value that is determined by local assessors to be the total taxable value of land and additions on the property. | Land | Improvement |
|---|---|---|---|---|
| 2025 | $6,772 | $543,104 | $383,874 | $159,230 |
| 2024 | $6,772 | $532,456 | $376,348 | $156,108 |
| 2023 | $6,541 | $522,017 | $368,969 | $153,048 |
| 2022 | $6,211 | $511,783 | $361,735 | $150,048 |
| 2021 | $6,076 | $501,749 | $354,643 | $147,106 |
| 2019 | $5,918 | $486,869 | $344,125 | $142,744 |
| 2018 | $5,768 | $479,434 | $337,378 | $142,056 |
| 2016 | $5,572 | $458,789 | $324,278 | $134,511 |
| 2015 | $5,492 | $451,899 | $319,408 | $132,491 |
| 2014 | $4,945 | $422,000 | $299,000 | $123,000 |
Source: Public Records
Map
Nearby Homes
- 9839 Pomering Rd
- 9530 Rives Ave
- 7375 Suva St
- 7373 Suva St
- 7371 Suva St
- 7344 Foster Bridge Blvd
- 7365 Suva St
- 7363 Suva St
- 7342 Foster Bridge Blvd
- 7845 Gainford St
- 7205 Glencliff Dr
- 10246 Julius Ave
- 10253 Hopeland Ave
- 7745 Coolgrove Dr
- 6545 Dos Rios Rd
- 6502 Dos Rios Rd
- 6460 Dos Rios Rd
- 7310 Bluff Rd
- 7333 Via Rio Nido
- 9315 Parrot Ave
- 9637 Julius Ave
- 9647 Julius Ave
- 9631 Julius Ave
- 9640 Pomering Rd
- 9705 Julius Ave
- 9646 Pomering Rd
- 9636 Pomering Rd
- 9702 Pomering Rd
- 9630 Pomering Rd
- 9640 Julius Ave
- 9625 Julius Ave
- 9711 Julius Ave
- 9646 Julius Ave
- 9702 Julius Ave
- 9708 Pomering Rd
- 9630 Julius Ave
- 9624 Pomering Rd
- 9621 Julius Ave
- 9717 Julius Ave
- 9706 Julius Ave
Your Personal Tour Guide
Ask me questions while you tour the home.