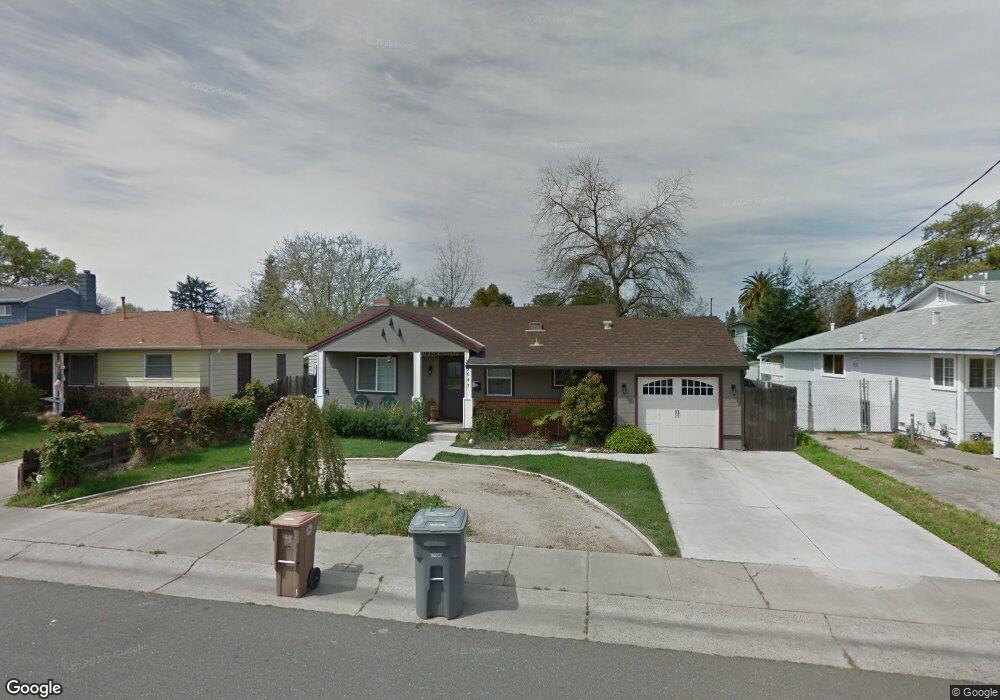
9647 Eisenbeisz St Elk Grove, CA 95624
South East Elk Grove NeighborhoodEstimated Value: $387,000 - $468,000
3
Beds
1
Bath
1,150
Sq Ft
$383/Sq Ft
Est. Value
About This Home
This home is located at 9647 Eisenbeisz St, Elk Grove, CA 95624 and is currently estimated at $440,581, approximately $383 per square foot. 9647 Eisenbeisz St is a home located in Sacramento County with nearby schools including Elk Grove Elementary School, Joseph Kerr Middle School, and Elk Grove High School.
Ownership History
Date
Name
Owned For
Owner Type
Purchase Details
Closed on
Jan 19, 2021
Sold by
Jacobs Cassandra
Bought by
Waring James S and Waring Karen A
Current Estimated Value
Home Financials for this Owner
Home Financials are based on the most recent Mortgage that was taken out on this home.
Original Mortgage
$343,660
Outstanding Balance
$306,718
Interest Rate
2.71%
Mortgage Type
FHA
Estimated Equity
$133,863
Purchase Details
Closed on
Apr 11, 2011
Sold by
Jacobs Cassandra
Bought by
Clj Corporation
Purchase Details
Closed on
Nov 22, 2006
Sold by
Browning John E and Probate Case #06Pr00719
Bought by
Jacobs Cassandra
Home Financials for this Owner
Home Financials are based on the most recent Mortgage that was taken out on this home.
Original Mortgage
$167,900
Interest Rate
6.37%
Mortgage Type
Balloon
Purchase Details
Closed on
May 25, 1999
Sold by
Arndt Richard A
Bought by
Arndt Debra Ann and Arndt Richard A
Create a Home Valuation Report for This Property
The Home Valuation Report is an in-depth analysis detailing your home's value as well as a comparison with similar homes in the area
Home Values in the Area
Average Home Value in this Area
Purchase History
| Date | Buyer | Sale Price | Title Company |
|---|---|---|---|
| Waring James S | $350,000 | Old Republic Title Company | |
| Jacobs Cassandra | -- | Old Republic Title Company | |
| Clj Corporation | -- | None Available | |
| Jacobs Cassandra | $227,000 | Placer Title Company | |
| Arndt Debra Ann | -- | -- |
Source: Public Records
Mortgage History
| Date | Status | Borrower | Loan Amount |
|---|---|---|---|
| Open | Jacobs Cassandra | $343,660 | |
| Previous Owner | Jacobs Cassandra | $167,900 |
Source: Public Records
Tax History Compared to Growth
Tax History
| Year | Tax Paid | Tax Assessment Tax Assessment Total Assessment is a certain percentage of the fair market value that is determined by local assessors to be the total taxable value of land and additions on the property. | Land | Improvement |
|---|---|---|---|---|
| 2025 | $4,114 | $378,848 | $124,478 | $254,370 |
| 2024 | $4,114 | $371,421 | $122,038 | $249,383 |
| 2023 | $4,008 | $364,140 | $119,646 | $244,494 |
| 2022 | $3,933 | $357,000 | $117,300 | $239,700 |
| 2021 | $3,149 | $280,958 | $179,470 | $101,488 |
| 2020 | $3,105 | $278,078 | $177,630 | $100,448 |
| 2019 | $3,255 | $272,627 | $174,148 | $98,479 |
| 2018 | $2,963 | $267,283 | $170,734 | $96,549 |
| 2017 | $2,910 | $262,043 | $167,387 | $94,656 |
| 2016 | $2,673 | $248,242 | $158,570 | $89,672 |
| 2015 | $2,518 | $234,192 | $149,595 | $84,597 |
| 2014 | $2,308 | $212,901 | $135,995 | $76,906 |
Source: Public Records
Map
Nearby Homes
- 9271 Elk Grove Blvd
- 9244 Rancho Dr
- 9648 La Nuez Dr
- 9220 Cupertino Dr
- 9113 Buckskin Ct
- 9018 El Oro Plaza Dr
- 9467 Monte Cresta Way
- 8955 El Mirador Dr Unit 3
- 9669 Anton Oaks Way
- 9430 2nd Ave
- 9436 Viridian Way
- 9616 Apple Mill Dr
- 9562 E Park Dr
- 9497 Sara St
- 9416 Lyndley Plaza Way
- 9692 Melrose Ave
- 9465 Mainline Dr
- 9452 Lyndley Plaza Way
- 9968 Falcon Meadow Dr
- 9158 Falcon Creek Cir
- 9651 Eisenbeisz St
- 9643 Eisenbeisz St
- 9655 Eisenbeisz St
- 9638 Eisenbeisz St
- 9657 Kent St
- 9646 Eisenbeisz St
- 9642 Eisenbeisz St
- 9650 Eisenbeisz St
- 9665 Kent St
- 9659 Eisenbeisz St
- 9651 Kent St
- 9639 Eisenbeisz St
- 9654 Eisenbeisz St
- 9184 Grove St
- 9180 Grove St
- 9172 Grove St
- 9673 Kent St
- 9188 Grove St
- 9658 Eisenbeisz St
- 9675 Kent St